Market Overview: Bitcoin Futures
Bitcoin Q1 2023 Futures increased +73.94% its value during the first Quarter of 2023. Bitcoin is trying to resume the long-term bull trend, but sideways trading between $15000 and $50000 is more likely during the upcoming years.
Bitcoin futures
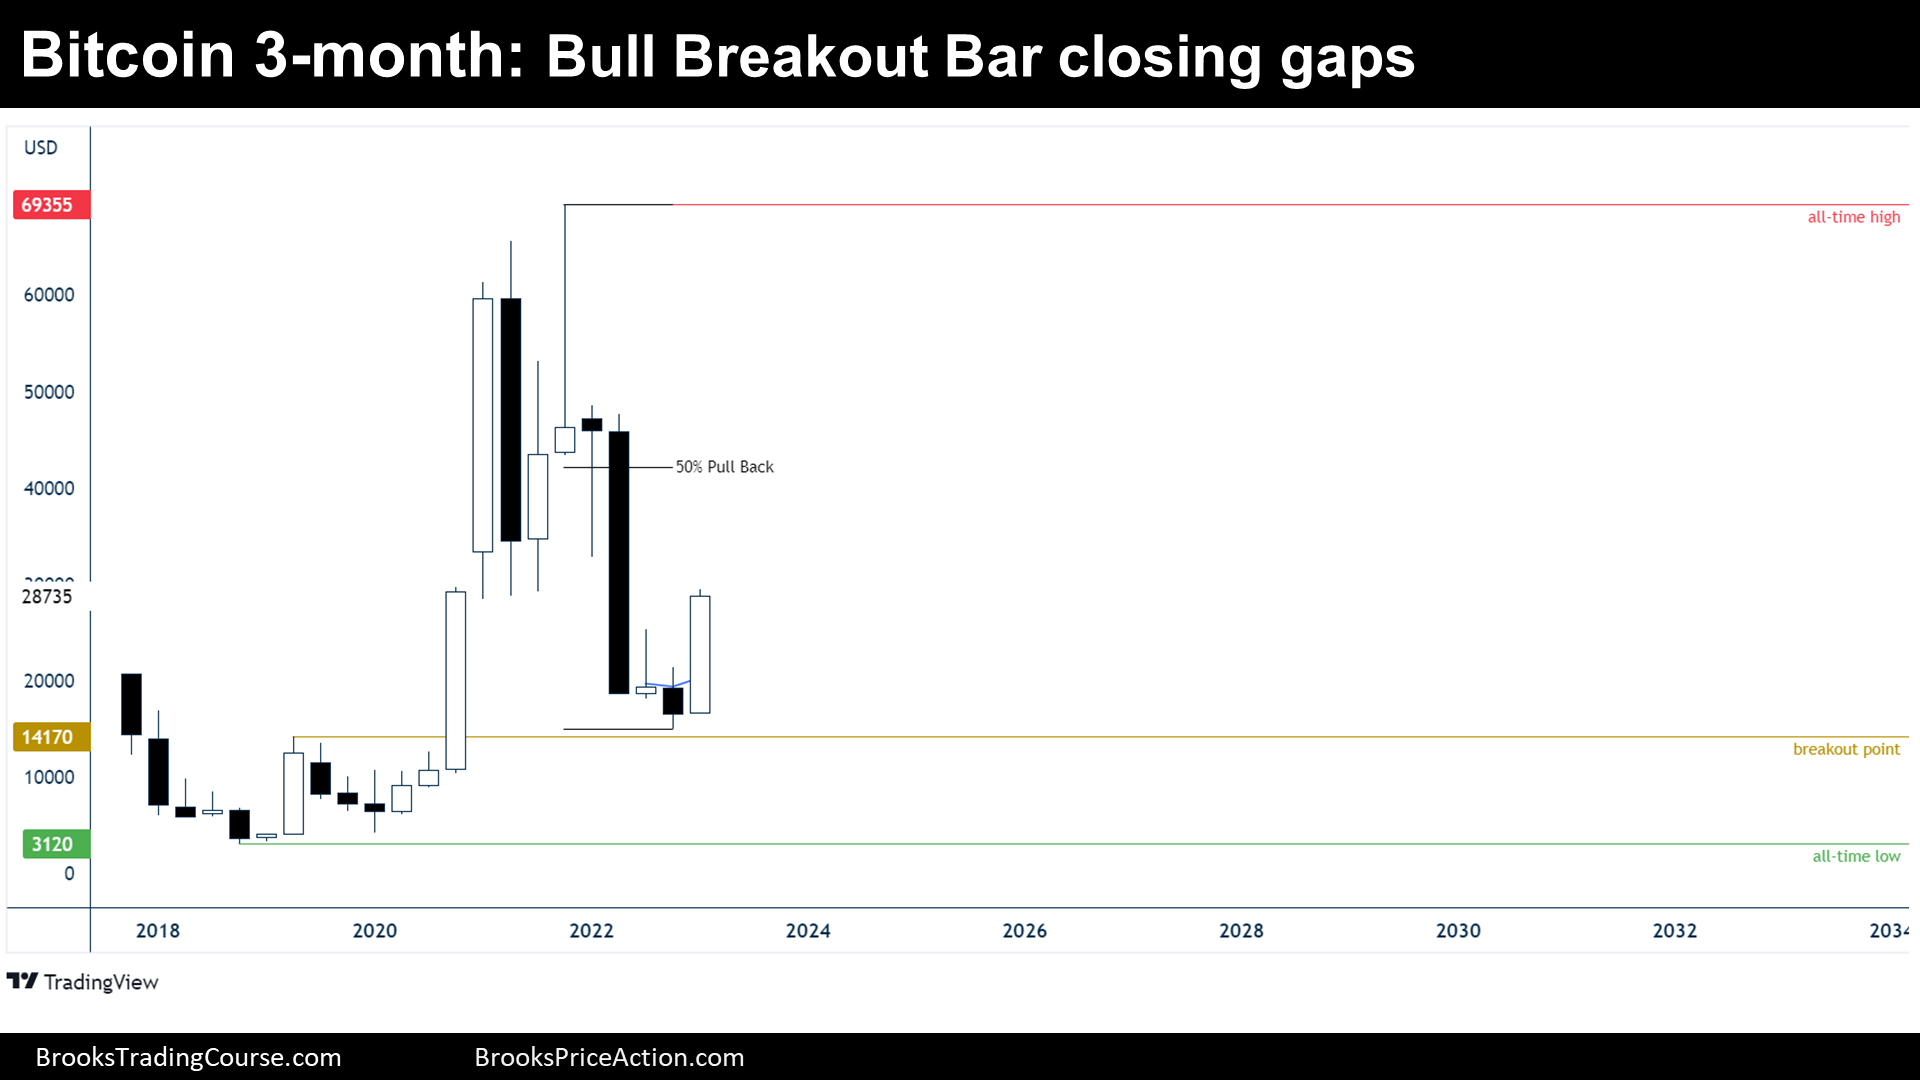
The 3-month chart of Bitcoin futures

Analysis
- 2023 1st Quarter (Q1) candlestick is a bull breakout bar closing at its high. The bar is closing the gap between the price and a prior minor higher low (Q2 2021).
- The price is probably within a bull flag pattern during a bull trend, since the price holds above a major higher low (2020 low) after achieving a higher high: 2020s breakout above 2017 high.
- But the bull flag is significantly deep, which means that there were bulls that bought too high. Those bulls will probably sell during rallies, limiting or adding difficulty to a potential upside.
- Bears are not getting good follow through after their bear bars, which means that they do not want to sell low.
- Bulls would rather not buy high, Bears would rather not sell low: trading range trading is likely.
- Nowadays, with the current information, traders should expect a trading range during the next 20 bars. 20 bars on a 3-month chart mean 5 years, thereafter, a resumption of the bull trend will be more likely if the price manages to be above its major higher low.
Trading
- Bulls: they might want to buy above the current bull signal bar, but the problem is that the previous selloff was strong enough to expect another leg sideways to down. Hence, they will do better waiting a 2nd entry or buying at Q2 2022 close or below bars.
- Bears: they might want to sell higher, like at or around a 50% retracement of the previous selloff. Those who sold at the Q2 2022 close, will try to exit (buy) breakeven if the price comes down to their entry price.
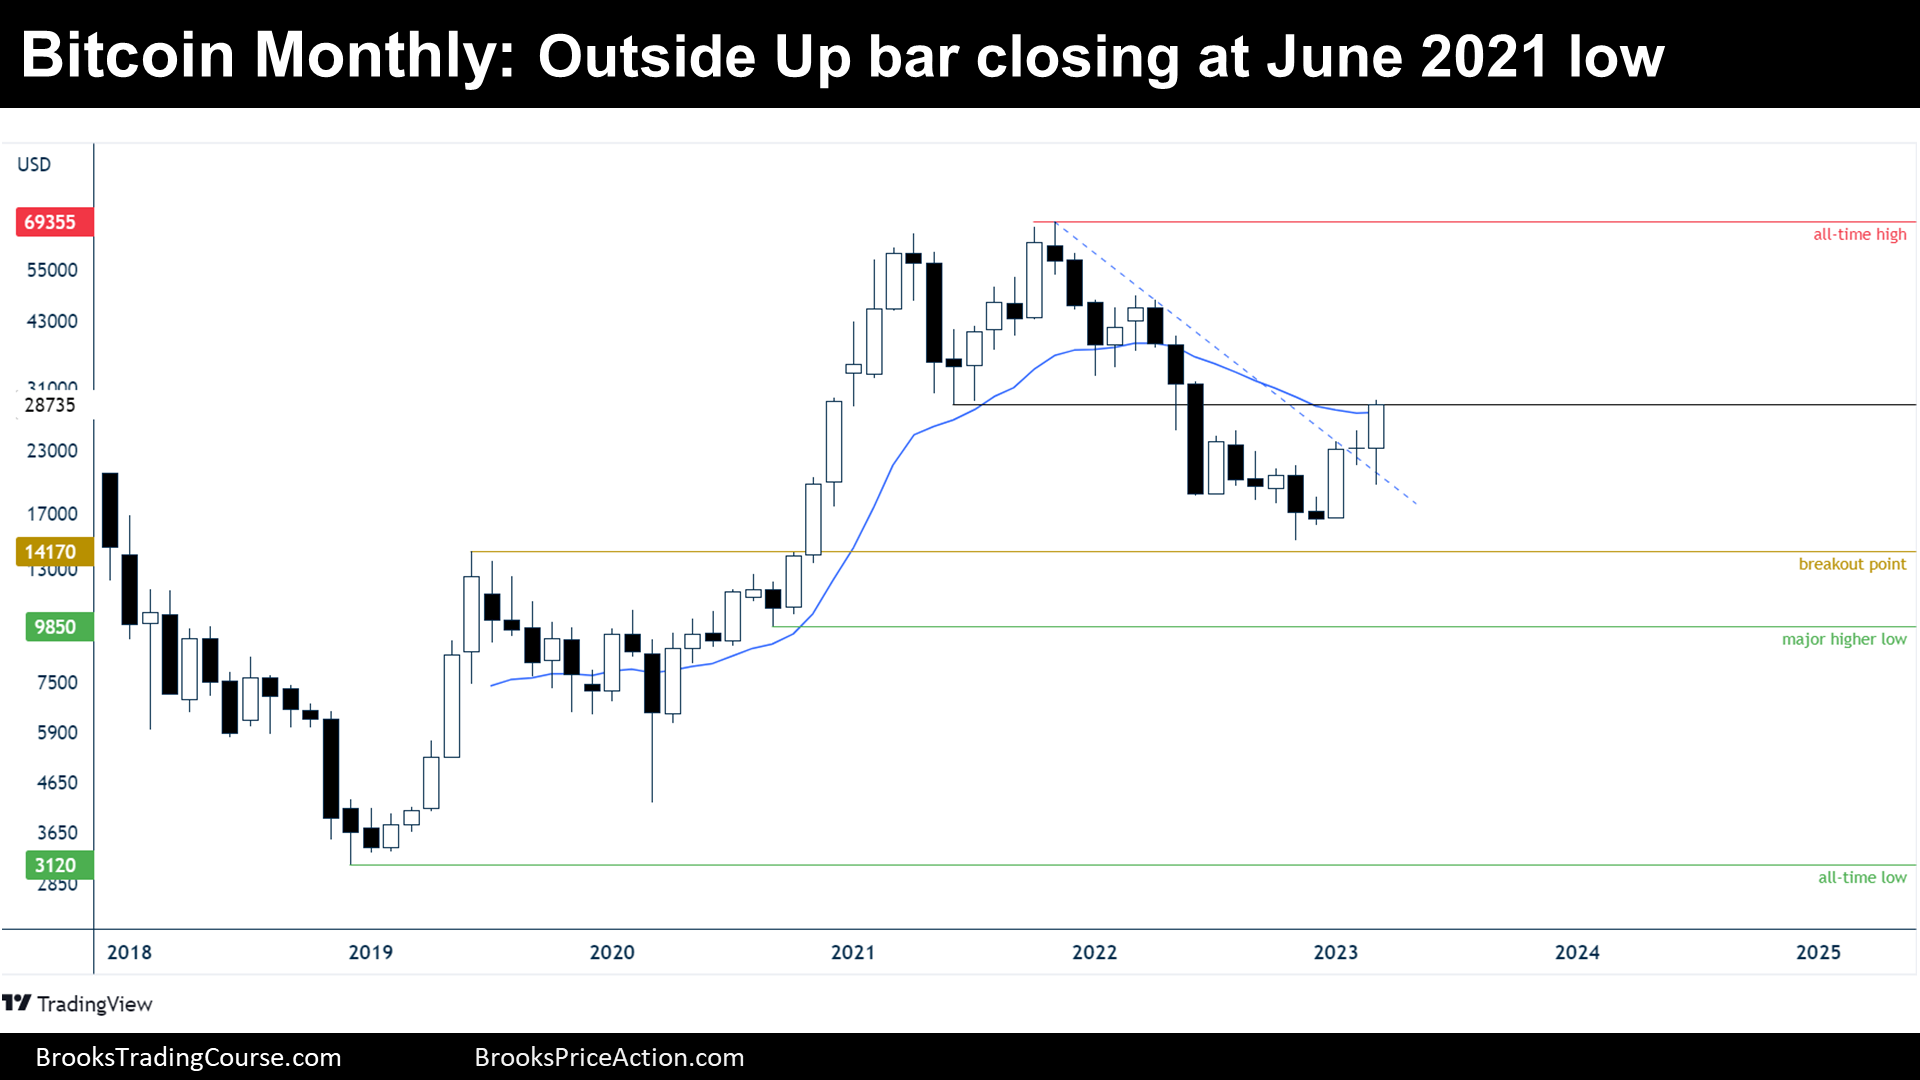
The Monthly chart of Bitcoin futures

Analysis
- March candlestick’s is an outside up bar closing at the June 2021 low.
- The price definitely broke above the prior bear channel, meaning that bulls did a good step towards stopping the bearish inertia.
- More importantly, during March the price closed the June 2021 low gap.
- We have been saying since last year that there were probably bulls trapped into long buying below the June 2021 low, since it was a reasonable buy: buying the bottom of a trading range that followed a bull trend.
- Moreover, we have been saying repeatedly that the price was probably within a trading range market cycle, not within a strong bear trend. Trading ranges tend to close the gaps, and fail the breakouts. Also, during trading ranges, below the 20 exponential moving average (20 EMA) is considered cheap, and above the 20 EMA it is considered expensive: March closed above the 20 EMA.
- Traders do not forget that before this up move, there was a tight bear leg, and that the first reversal up would be probably minor.
- Traders won’t probably buy strongly if they think that there are trapped bulls selling or if they think that they are not buying cheap.
- Therefore, it is better to not expect much upside potential during April.
Trading
- Bulls: Even if March looks like a good buy signal bar, I think that the context is not promising for the bulls; thus, bulls should wait until there is another leg sideways to down before buying.
- Bears: They can sell at the June 2021 low or at or around a 50% retracement of the prior bear leg, but they should probably be quick to take profits since bulls are closing gaps.
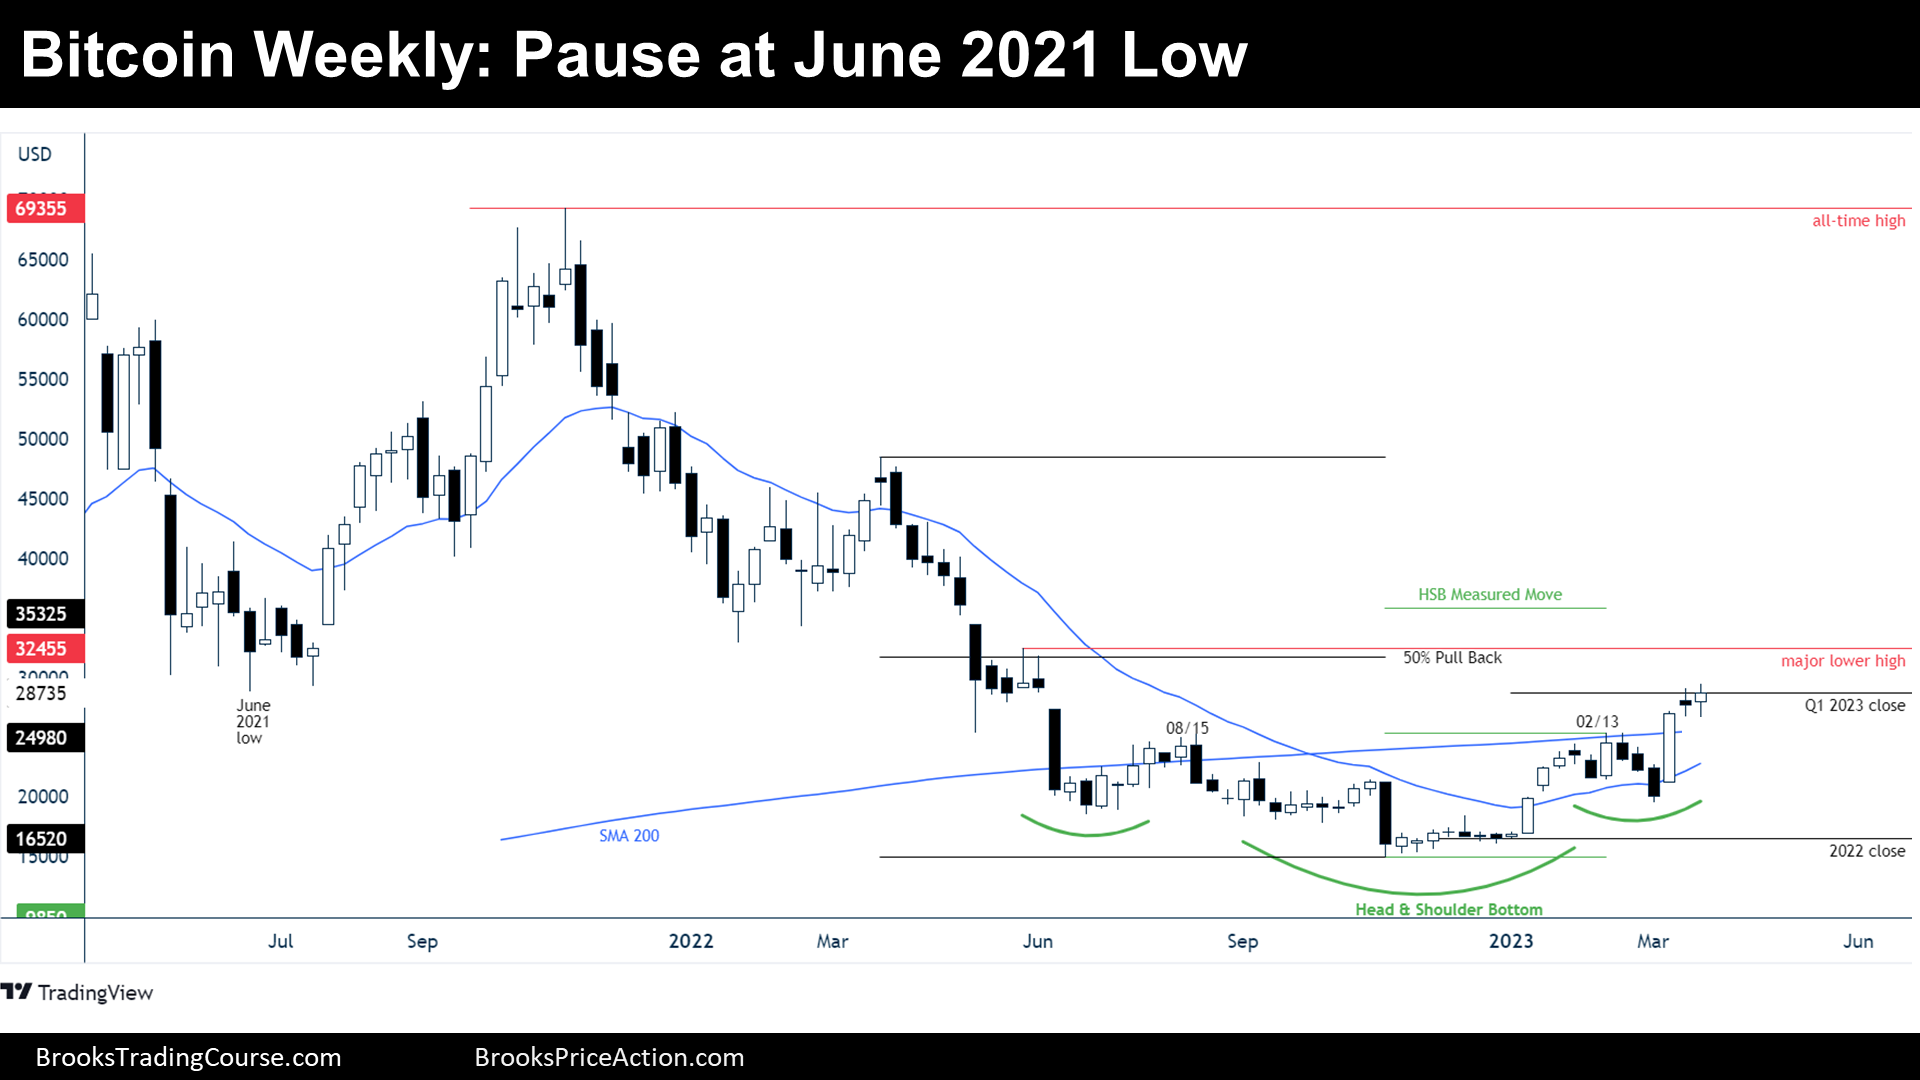
The Weekly chart of Bitcoin futures

Analysis
- Last week’s candlestick is a bull doji closing at the June 2021 low. It is the second consecutive doji after the bulls broke above a head and shoulders bottom (HSB) pattern.
- The Q1 2023 close at $28735 will be one of the most important prices to look at, together with the 2022 close at $16520 and the prior major lower high, during the next Quarter.
- Bulls want a measured move up of the HSB, and they might get it, but the price will probably continue its trading range inertia. Actually, 2 dojis followed the HSB bull breakout, which are signs of hesitation.
- During the following days, traders want to see what happens at the Q1 2023 close, if there is buying or if there is selling.
- Since the price is at resistances and not breaking yet clearly to the upside, traders should expect sideways to down trading during the following weeks.
Trading
- Bulls: They should wait to buy above a good bull bar closing on its high, expecting to get to the HSB measured move.
- Bears: In terms of probability, risk and reward, they are probably at a sweet spot where they can sell reasonably at, above and below things.
Market analysis reports archive
You can access all weekend reports on the Market Analysis page.