Market Overview: Bitcoin Futures
Bitcoin Futures Q2 2023 (2nd Quarter of 2023) Weak Bull Follow Through after Q1’s Bull Signal Bar. The price increased its value by 6.72% during the current quarter. The price is going towards Q1 2021 low gap, meanwhile the Q4 2022 high gap is open. On the weekly chart, the candlestick is a small doji as a Follow Through after the past week’s bull signal bar. The bar did not close any bearish gap, so the potential up is still intact; however, it is not the kind of Follow Through that bulls want: some will exit their trade or tight their stops, others will exit if there are lower highs and lows on lower timeframes (Daily or 4/8-hour chart).
Bitcoin futures
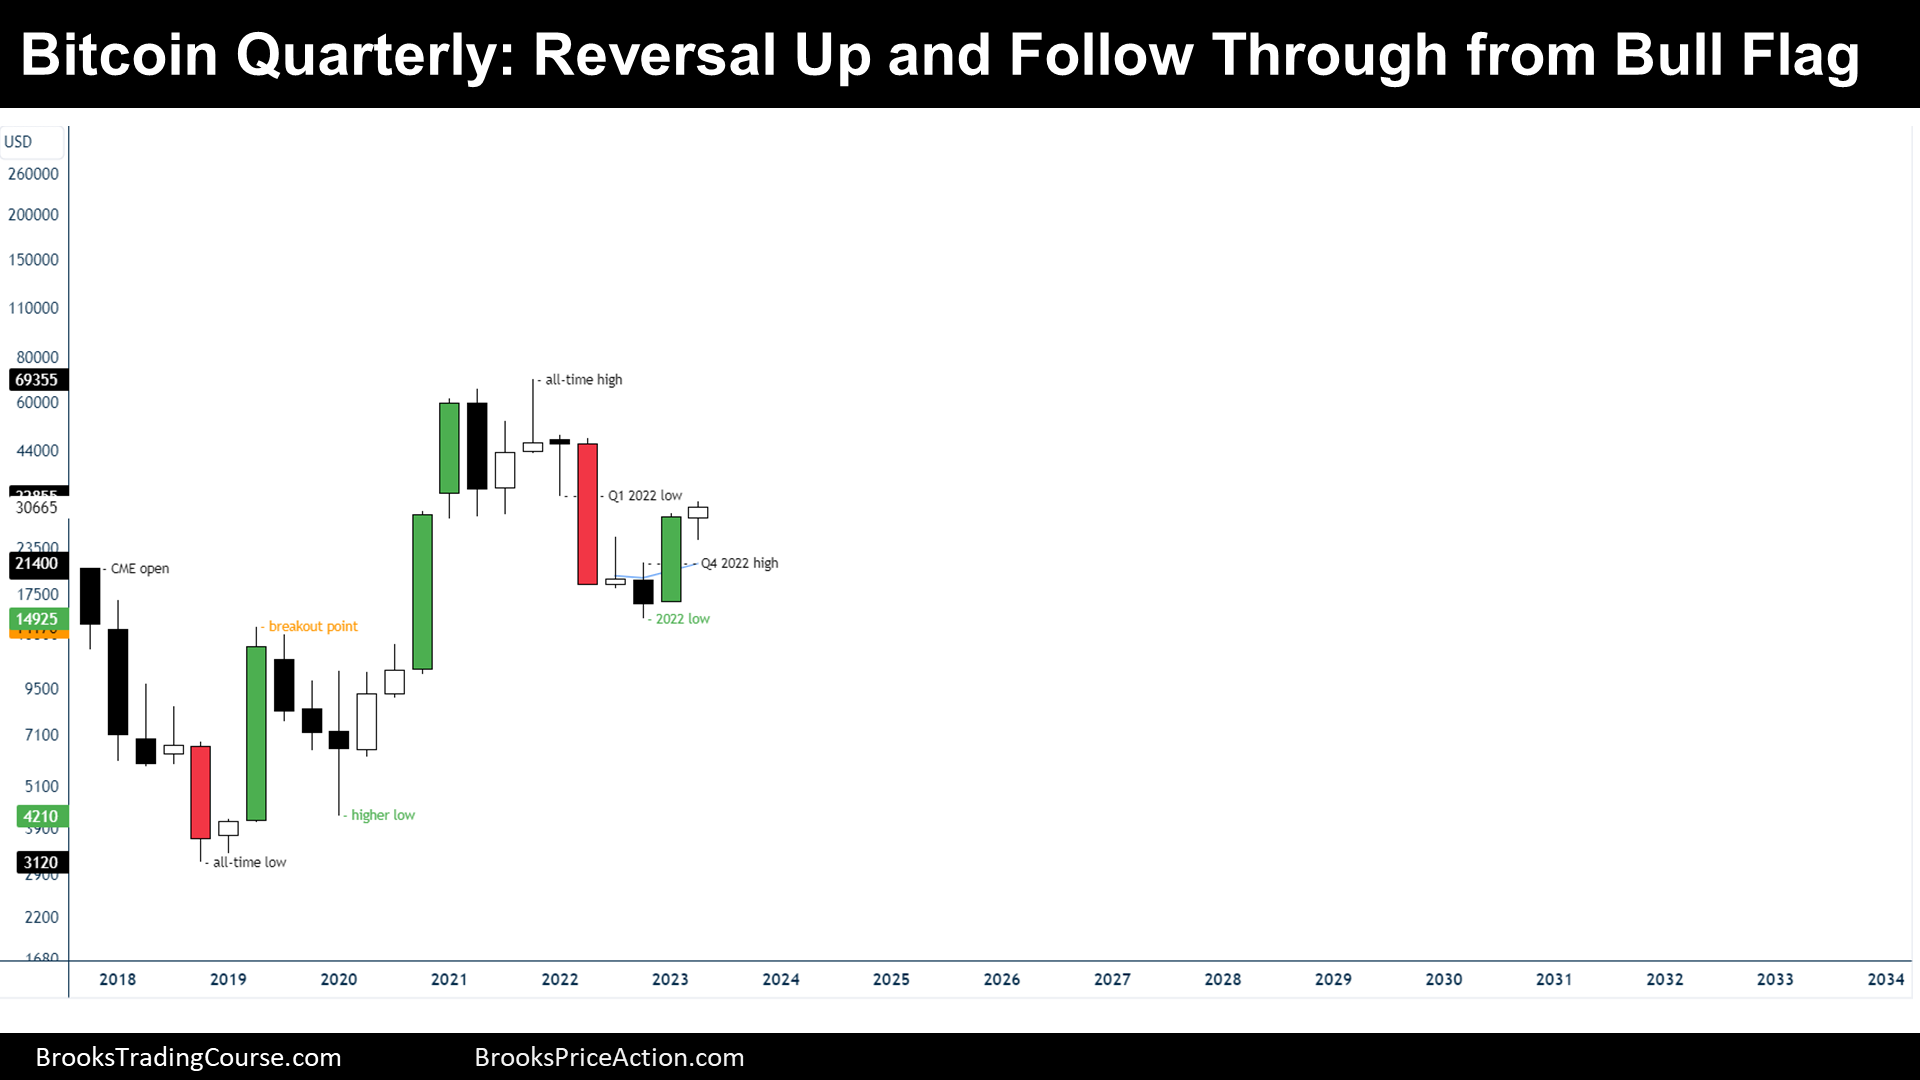
The Quarterly chart of Bitcoin futures

Analysis
- This Quarter’s candlestick is a small bull bar with a tail on both ends. The current bar is the Follow Through Bar of a Bull Signal bar on Q1.
- During Q2 2023, the price tried to close a downside gap by trading towards the Q4 2022 high, but then reversed up and achieved a new high of the bar.
- The Bulls will probably close the Q1 2022 low gap during the next bar or bars.
- Q2 2023 follow through bar is not bad, but is weak compared with what it could be: another trend bar with an open near the low, and a close near the high.
- Hence, the price is likely going to trade upwards until the Q1 2022 low, but then might test prior bar lows before trying to achieve its final goal: test the all-time high.
- The bears want to maintain the Q1 2022 low gap open and get to the Q4 2022 high because this will mean that bears are stronger than bulls at the $30000 area.
- Closing the Q1 2022 will mean, at least, that sideways trading is more likely than a bear trend continuation (actual bull flag).
- Closing the Q1 2022 low gap and keeping the Q4 2022 high gap open during consecutive quarters will be viewed as constructive for bulls.
Trading
- Bulls:
- Q2 2023 candlestick is not a good buy signal bar.
- Q1 2023 buyers might not close their trade because Q2 2023 is not enough threatening for them, but they might adjust their risk when the price gets to the Q1 2022 low.
- Q1 2022 buyer’s minimum target is $55000, which is a 1:1 based upon their stop loss being at the major higher low. The probability of this happening within the next 20 bars (5 years) is higher than 50%: buy below $30000 with this stop loss and profit target is good based upon a trader’s equation.
- Bears:
- Q2 2023 is not a good Low 1 sell setup since it is a bull bar following a bull signal bar.
- Bears should probably wait for a Low 2 or a micro double top before selling.
- If they can keep the Q1 2022 low gap open when a bear sell setup appears, that will increase their chance of a bear continuation.
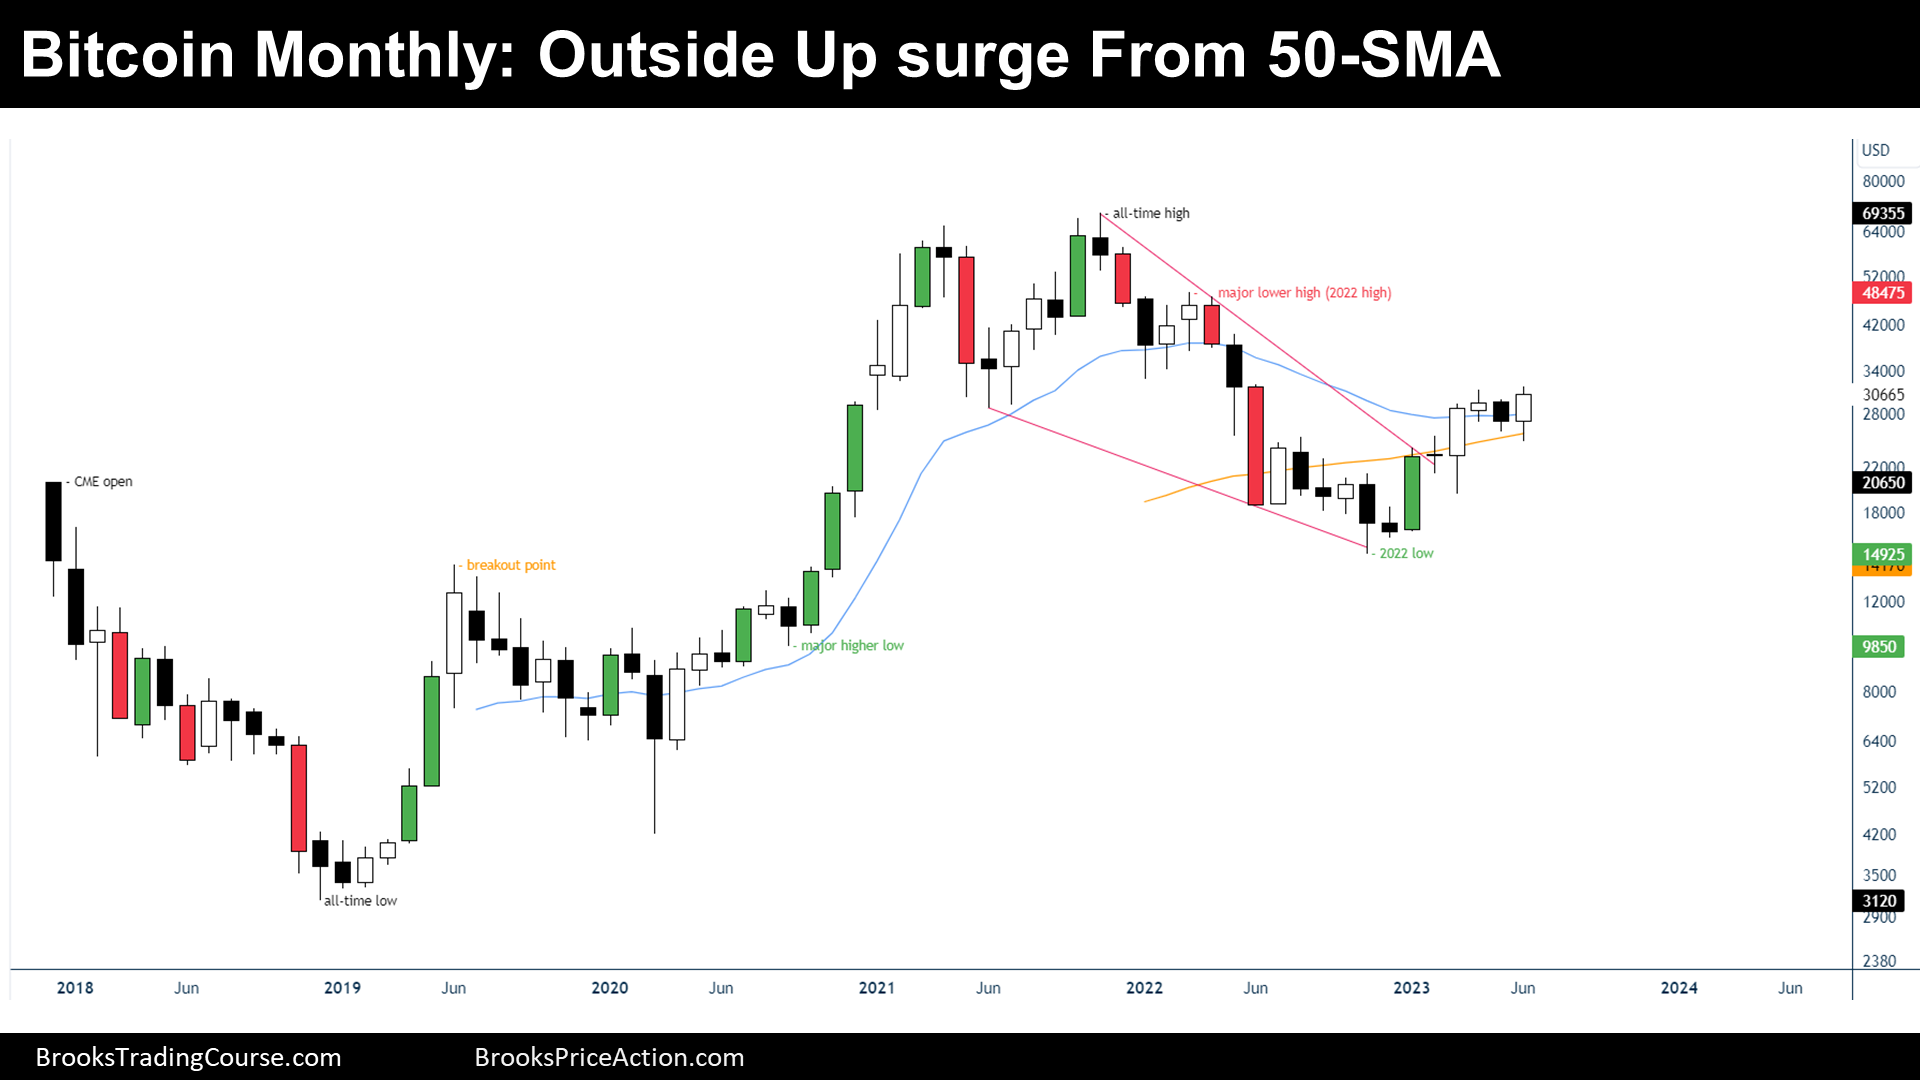
The Monthly chart of Bitcoin futures

Analysis
- June’s 2023 candlestick is a bull outside up bar, which surges from the 50-month simple Moving Average (50 MA).
- It has closed above its open and also above the May’s bar, that was a High 1.
- The price is within the first reversal up after a strong bear trend (major bull flag).
- When there is a reversal up from a bull flag, the bull’s goal is a test of prior lower highs.
- But the reversal up it is not specially strong, since there have not been a good pair of consecutive bull bars, and that normally means that pullbacks are expected while the price is trying to reach the prior lower highs.
- There are no clear higher lows and higher highs on this time frame, and hence, the major bull trend continuation thesis is not distinct yet.
- Overall, the direction that the price will follow during the upcoming months is uncertain, and unless there is a surprise, traders should expect sideways to up trading.
Trading
- Bulls:
- June’s 2023 might be a good buy signal bar, but since there have not been consecutive good bull bars during the 2023’s bull trend, I, personally, would hesitate buying with a stop order above.
- Bears:
- June’s 2023 candlestick is not a good sell signal bar.
- If July’s 2023 candlestick is a good sell signal bar, bears might sell a micro double top aspiring to test the 2022 low within the second half of the year.
Market analysis reports archive
You can access all weekend reports on the Market Analysis page.
Thanks Josep for another sharp report!
Wondering/thinking how likely re monthly chart the bulls are striving for a 2nd leg up (MM) from January 2023 low with April-June high that takes us to March 2022 MLH to the tick?
Also body wize only – April to June is an OOO Breakout Mode setup which is positive sign for the bulls with June being strong one.
Side note – I think you should color July 2022 as a green bar too.