Market Overview: Bitcoin
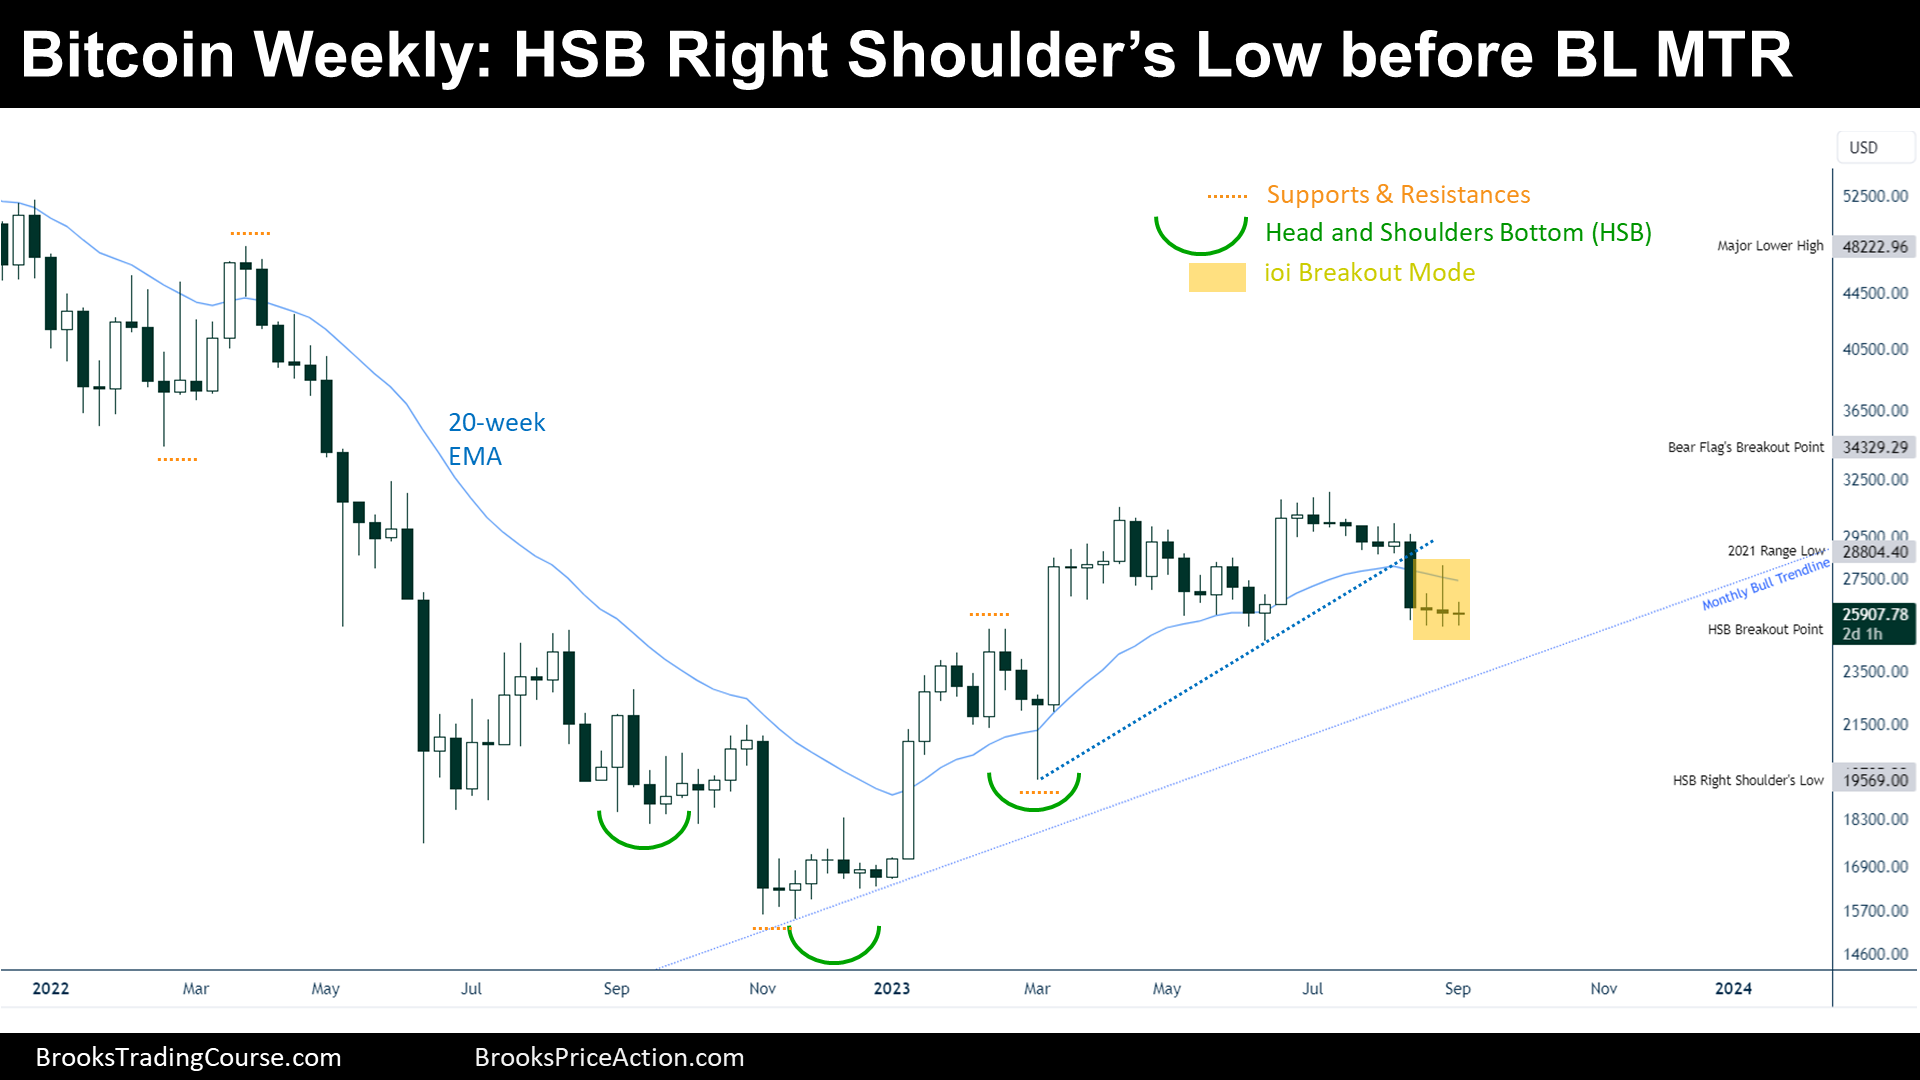
Bitcoin is pointing towards the Right Shoulder Low of the Head and Shoulders Bottom (HSB) pattern on the Weekly Chart. The Bulls could not trend strongly after the Bull Breakout of the HSB, apparently there has not been fuel enough; However, if the price trades at the Right Shoulder Low, it will find the Stop Loss (Sell Stop Orders) of the Bulls who correctly bought the HSB Bull Breakout… and managed the trade poorly. Furthermore, if it trades towards the Right Shoulder Low, it will find the Sell Stop Orders of Bears that expect a Bear Trend. That many Sell Orders, might be enough liquidity for big institutions that want to go long.
Bitcoin Spot
This weekend, there was an error with my source of CME Bitcoin Futures Data and instead, we analyze the Bitcoin Spot data provided by Tradingview. Bitcoin spot trades 24/7, and therefore, the Weekly Candlestick is not over at the time of the writing.
The Logarithmic Weekly chart of Bitcoin

Past: Supports and Resistances
“Every market probes up and down to discover how far is too far, which then becomes support and resistance. Once traders understand this and how to spot logical support and resistance levels, they are in a position to begin trading.” — Al Brooks.
- The price did a Bear Breakout of a Trading Range (you can also call it a Triangle) formed between early 2021 and early 2022.
- Major Lower High.
- Bear Flag Breakout Point.
- Then, the price continued to trend down within a bear channel until it reached strong supports and formed a reversal pattern: a HSB.
- 2022 Low.
- Right Shoulder Low.
- The Right Shoulder Low was followed by a Bull Breakout:
- HSB Breakout Point.
Present: Market Cycle

- There was a Bull Channel during 2023, and then the price went sideways. Now, the price it is still sideways, which means that the price has transitioned from a Bull Trend to a Broad Bull channel or even a Trading Range.
Future: Inertia
- During Trading Ranges, Traders want to Buy Low and Sell High. The Low of the Trading Range it is to be determined; however, the price tells us that the last time that Bulls did a strong move, was initiated from the $20000, where there is the HSB Right Shoulder Low.
- If the Bulls really intend to get to the Major Lower High, the price will probably have to test the Right Shoulder Low in the seek of Liquidity:
- Weak Bulls (Stop out of their Longs) and Weak Bears (Entering Shorts when context is bad) do the same thing, in this case, would be placing Sell Stop Order (At the Market Orders).
- IF institutions want to go Long, that is the place they need to reach.
If instead the price reverses up from here, it could create either a Head and Shoulders Top (HST) Pattern and a Triangle (T) Pattern, or a Wedge Top (WT) Pattern. If the price trades below the minor Higher Low located around $24500, and then reverses up, it will form an Expanding Triangle (ET) Pattern. The creation of these patterns will change the current Inertia thesis.
Trading
- Bulls:
- Some Bulls intend to buy a reversal up from the Bull Trend Line. However, as mentioned above, a reversal up from the Right Shoulder Low could create the best opportunity for an emerging Bull Swing.
- Bears:
- If a HST, T, WT or ET Pattern emerges, beginners will have a nice opportunity if they look for a reversal down from a failed Bull Breakout of those patterns.
- Either if this is a Broad Bull Channel or a Trading Range, they want to sell as high as possible.
- However, a good bear trend bar below the current ioi pattern, will be good for the seasoned ones.
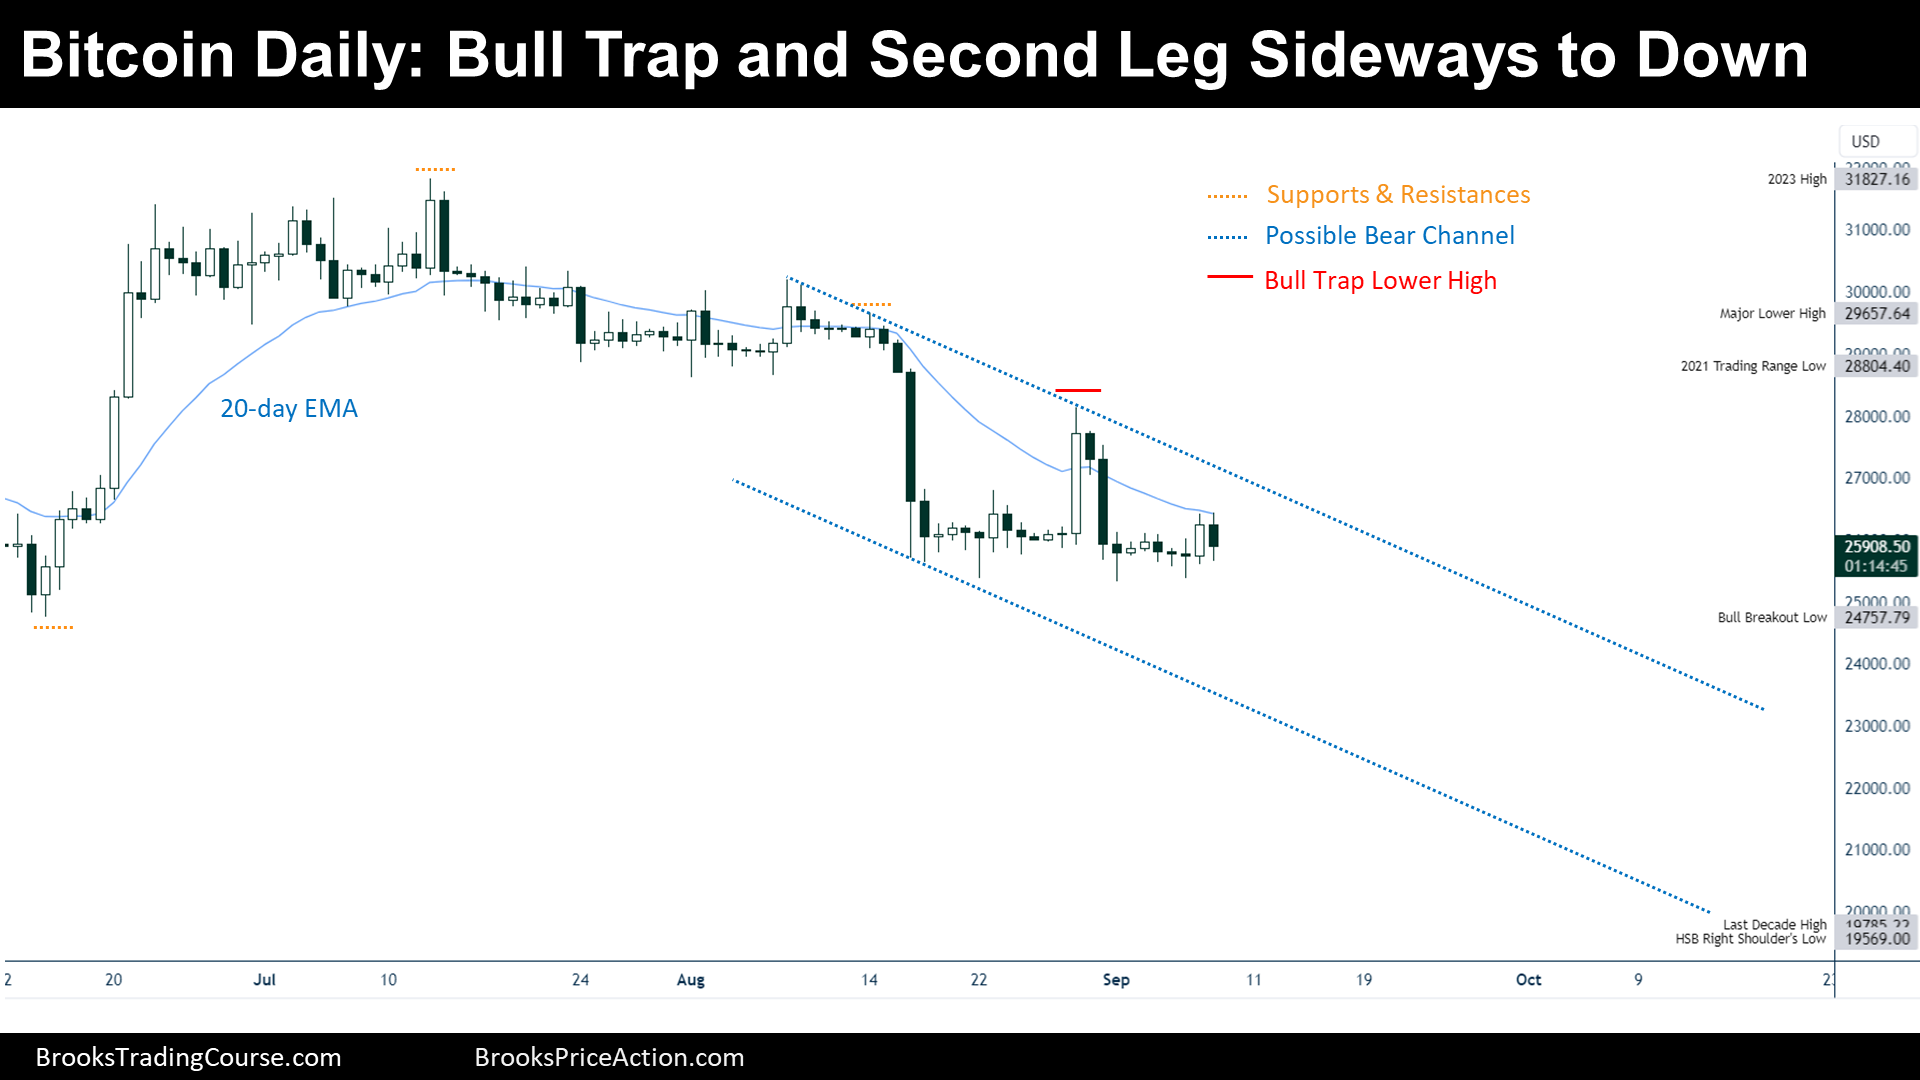
The Linear Daily chart of Bitcoin futures

Past: Supports and Resistances
- There was a Bull Breakout.
- Bull Breakout Low.
- Then, the price went sideways, forming a Tight Trading Range that broke slightly to the downside.
- Tight Trading Range High (2023 High).
- Moreover, the price entered an endless pullback until did a Strong Bear Breakout. After a Strong Bear Breakout, we expected a Second Leg Sideways to Down:
- Bull Trap and Lower High.
- After the Bull Trap and Lower High, the price did a new Low of the trend (it even traded below the Bull Breakout Low of BTC CME Futures).
- The price is now around Support, and traders want to see if we are within a Trending Market Cycle that will drive the price towards the Weekly Right Shoulder Low. However, if the price reverses up from here, Traders will assume that we are within a Trading Range (the price will constitute one of the patterns mentioned in the Weekly Analysis).
Present: Market Cycle
- The Market Cycle it looks like a Bear Trend.
- Bear Trends break Supports most of the time, and hence, if there is not a Bull Surprise or a lot of sideways Trading, Traders should expect the Bear Trend to Continue.
Future: Inertia
- Bear Trends tend to get to Magnets. The supports are magnets. The price will probably trade towards:
- Bull Breakout Low and then might trade towards:
- Lower Bear Channel Trend Line.
- Bull Breakout Low and then might trade towards:
Trading
- Bulls:
- They need a strong reversal up, a Bull Surprise, or a Bull Breakout of the Upper Bear Channel Trend Line.
- Bears:
- They dream of catching a move that has de potential to get to the Right Shoulder Low. However, they should be aware that the price is right above the Bull Breakout Low Support, and it can reverse up from here. Maybe they prefer to wait until the price starts to close below the Bull Breakout Low.
- They can sell below bear signal bars, a reversal down from the EMA, Low 2.
- Their Stop Loss stays at the Major Lower High, however, if they sell above the support, they should be experienced enough to know how to exit before the stop gets hit.
- They dream of catching a move that has de potential to get to the Right Shoulder Low. However, they should be aware that the price is right above the Bull Breakout Low Support, and it can reverse up from here. Maybe they prefer to wait until the price starts to close below the Bull Breakout Low.
Market analysis reports archive
You can access all weekend reports on the Market Analysis page.
Very informative analysis, and educational also . thank you
Hola Mike. We are glad that you enjoyed this report. Thank you for your comment, wishing you a great Trading week ahead!
Josep