Market Overview: Bitcoin Futures
Bitcoin sideways within tight range. The next week is the last trading week of the year, and the closing price of the yearly candlestick will become of paramount importance for traders during 2023. By the end of June, we have said that the second most influential price within any year, is the June close (half-year chart). That price ($18525) acted as support during the following 4-month trading range; now, is acting as resistance. Traders are waiting for the final verdict, and currently, the chances are that this year will close below the June close.
Bitcoin futures
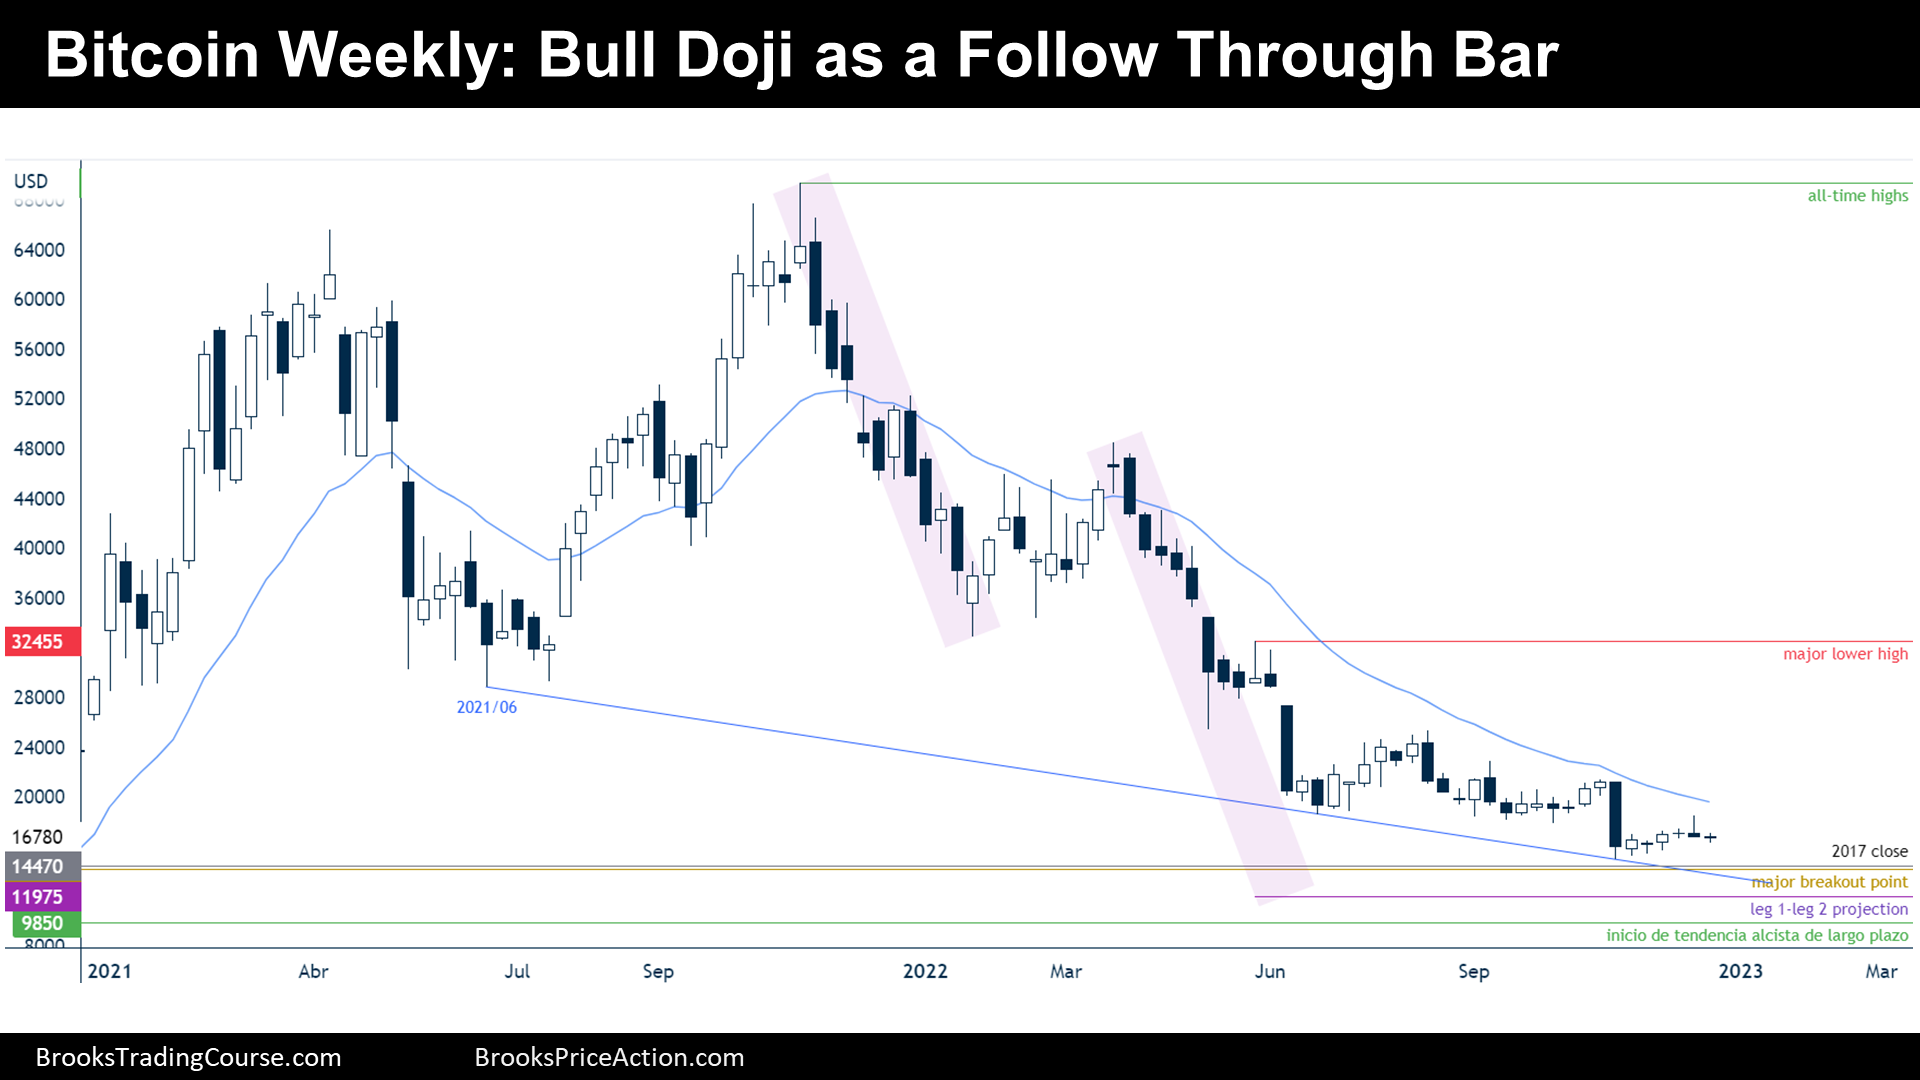
The Weekly chart of Bitcoin futures

- This week’s candlestick is a bull doji following a Low 1 bear sell setup; hence, it is a bad follow-through bar for those who sold the Low 1. It is a weak bull and sell signal bar for the next week.
- Bitcoin sideways trading to down since June, a sign that the bear trend has been weakening.
- Bears want to get to a new low next week to end the year at fresh new lows.
- Bulls aim to close above June close at $18525, to claim that bulls & bears buy below bars. The bulls need consecutive bull bars to seriously attempt to break the bearish inertia.
- Bear trends end either by trading at prior major lower highs or by trading sideways. Traders cannot say that the Bitcoin sideways trading since June ended the bear trend because the bull attempts were weak and the price achieved new lows after them. Bear’s last will is to get to $9850 to technically claim that the long-term bull trend is over.
- The price will find strong supports, which are also magnets, between $14000 and $15000. There, there is the 2017 closing price at $14470 and a prior major breakout point at $14170. Bulls can reasonably try to buy reversals around this area.
- The context favors slightly bears for the next week; however, traders should remember that $18525 (June close) is the strongest magnet around and that price is below.
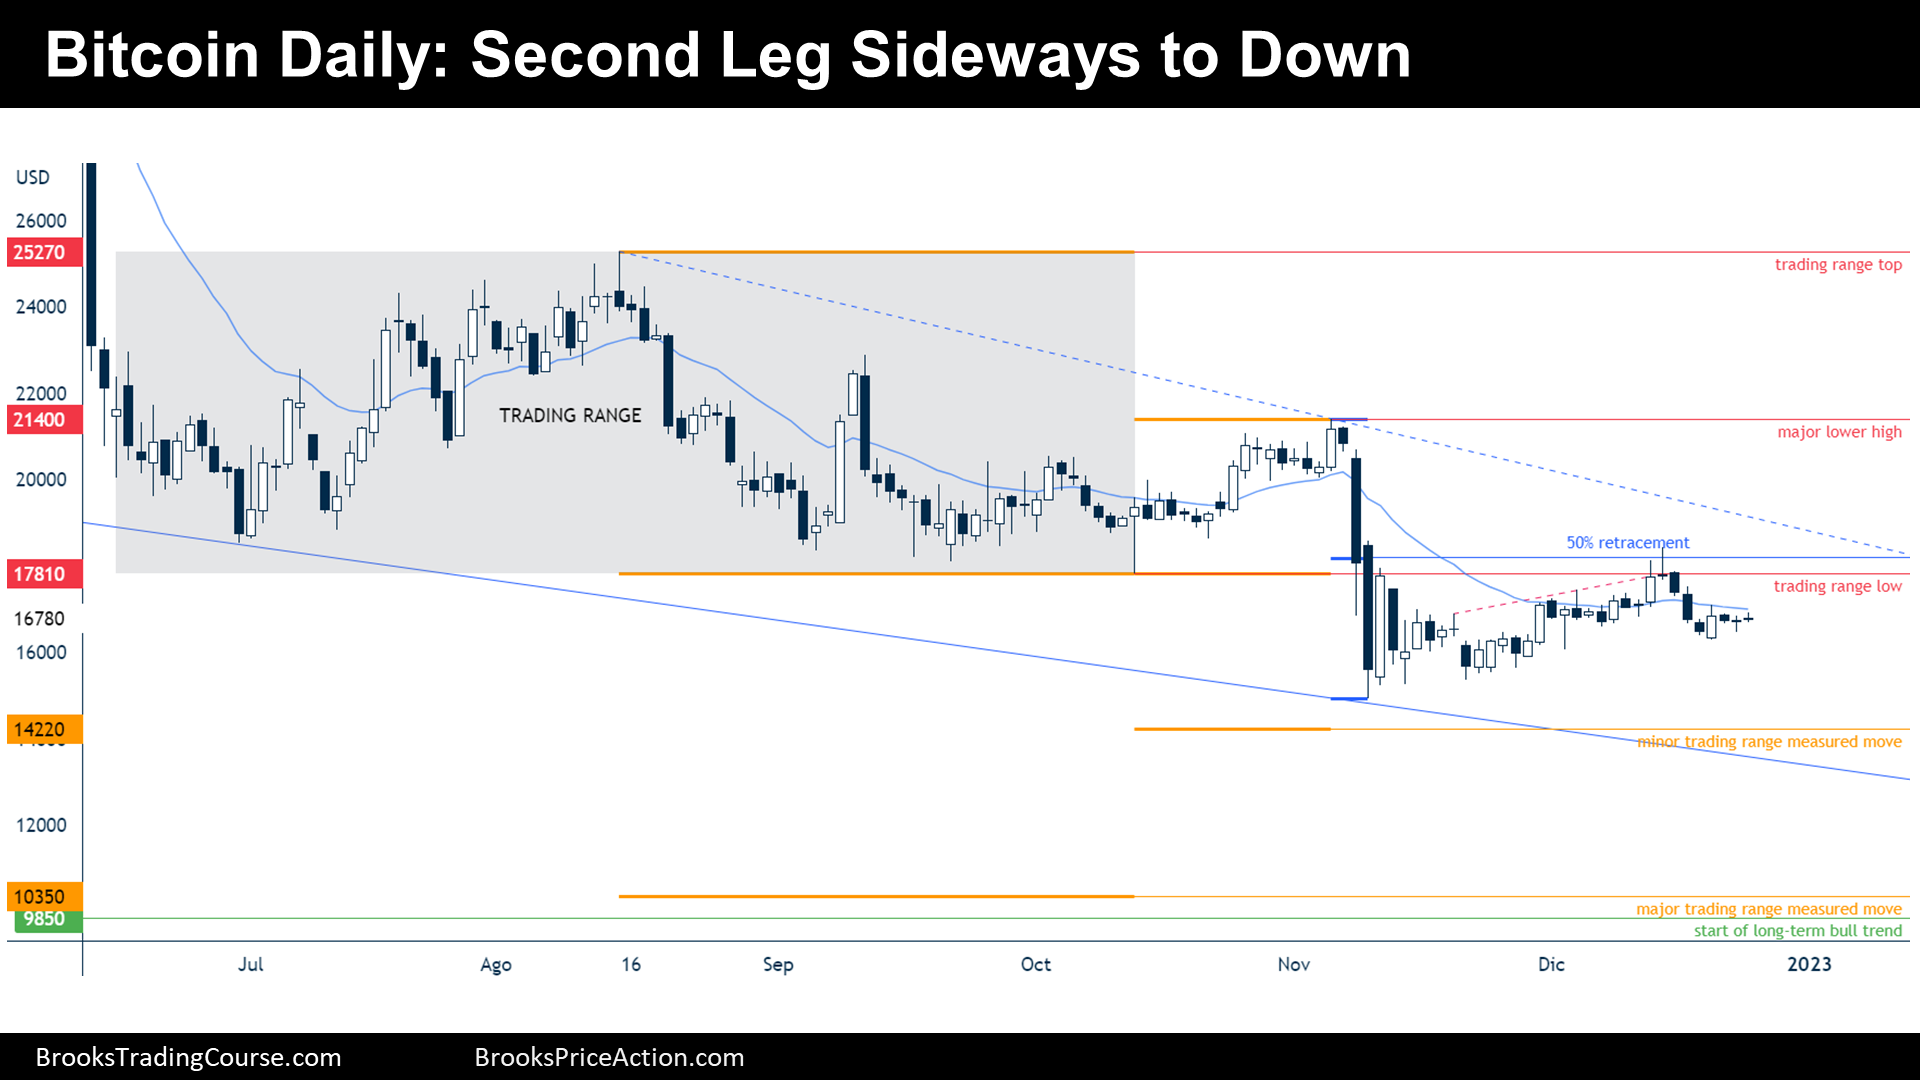
The Daily chart of Bitcoin futures

- Last week, I have said that the odds were that the price was within a two legs sideways to down period, which is what usually occurs after a wedge top.
- The overall context is trading range price action. In this environment, the price tends to close gaps, testing prior highs and lows.
- This week, the price traded within a very tight trading range.
- The bears want the second leg down starting next week and to test prior higher lows. Their most reasonable target is to get to a minor trading range measured move at $14220.
- The bulls want to trade above the December high, they hope that the bears who sold the 3 consecutive bear bars have their stops above December’s high. Moreover, bulls know that they sit at a strong support area and they will try to buy any reasonable reversal setup.
- The odds favor another leg down starting next week; however, next week is the final week of the year, and there are magnets above that might play a bigger role than lower timeframe patterns.
- Finally, but not least important… Merry Christmas to everyone!
Market analysis reports archive
You can access all weekend reports on the Market Analysis page.