Market Overview: Bitcoin Futures
Bitcoin test of trend line top, touching weekly bear trend line by continuing to trade sideways for another consecutive week. Lately, the volatility has been contracting, an aspect that should be constructive looking forward into the future. However, the price remains below major resistances and while the bulls do not step in, the downside continuation is more likely.
Bitcoin futures
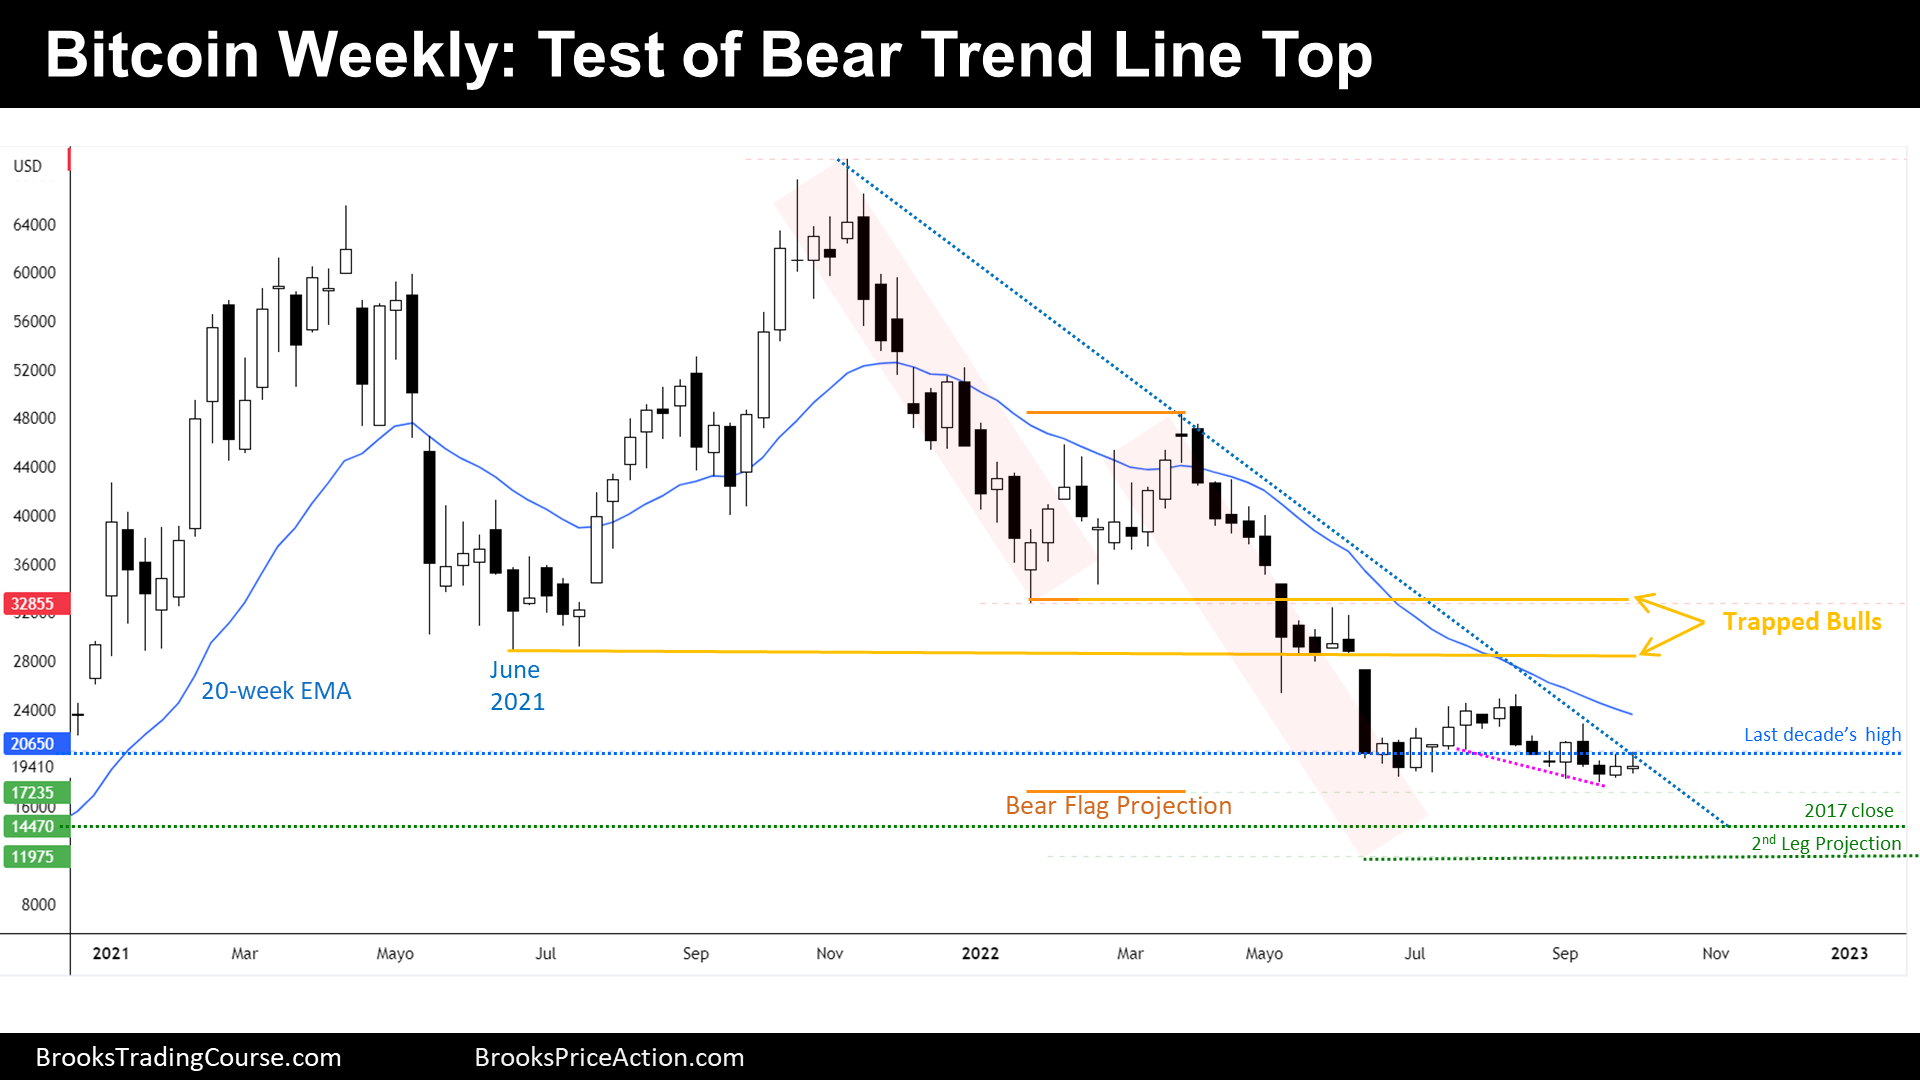
The Weekly chart of Bitcoin futures

- This week’s Bitcoin candlestick is a small bull doji with a prominent tail above its close.
- During the week, the price tested the top of the bear trend line, which confluences with 2017 highs, and then reversed down.
- Bulls see a small wedge bottom and a zone that is holding the bear trend for many weeks. But that will not be enough to stop bears from achieving their goal. There are no bull breakout bars with follow through anywhere.
- As we have been saying during the past months, there are trapped bulls at around $30000 that will likely have the chance to exit their trades without a loss. But traders will only look to the upside when bulls do a convincing offensive like break up the bear trend line, or start to create consecutive bull bars.
- Bears will probably reach the bear flag measured move at some point, that means that the price has to go to $17235 before bears exit.
- Bears have more ambitious targets like the 2017 close, or a measured move based upon leg 1-leg 2. But first, they have to pass the $17235 milestone.
- The price is contained within a bear channel. A bear channel breaks 70% of the time to the upside. At some point, we should expect a breakout of the top of the bear trend line. This can be achieved only by going sideways, that is the ultimate behavior expressed on this chart. Before that happens, bears will likely reach more of their targets.
- This week’s candlestick, it is not a great sell signal bar for the next week because it is a doji, with a bull body. The price is trading sideways for many weeks, but since we are within a bear channel, we should expect sideways to down trading until there is a bull breakout of the bear trend line.
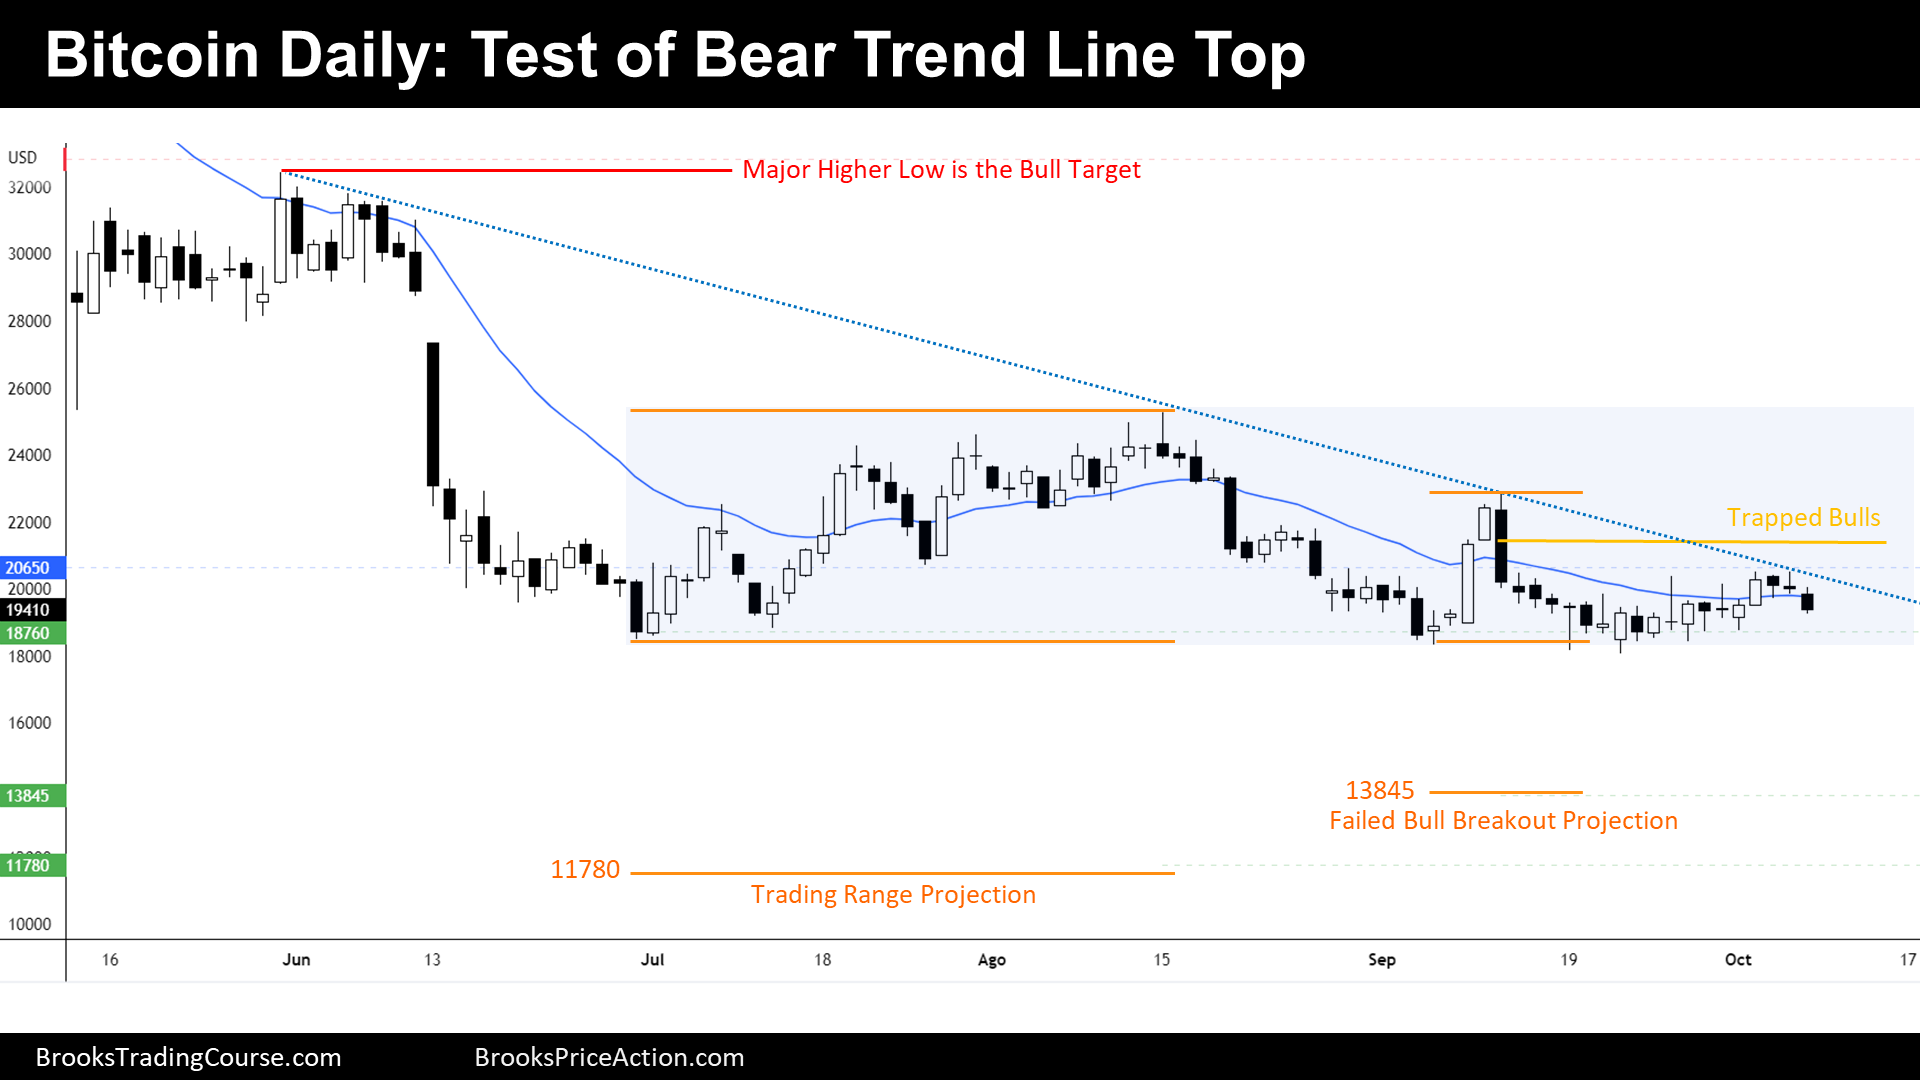
The Daily chart of Bitcoin futures

- During the week, the price went up and then reversed down, continuing with the trading range price action that started during June.
- The past two weeks, price was contained within a tight trading range.
- By trading sideways, the price also reached the top of a bear trend line. The price is stalling at different resistances simultaneously on higher and lower timeframes.
- Some bulls are trapped above current prices because they bought a failed bull breakout. They might add selling pressure if they decide to accept a loss before they have a chance to exit their trades breakeven.
- The top of the bear trend line denotes that bears are insisting on breaking the trading range to the downside. We should expect another breakout attempt soon.
- But a tight trading range is a breakout mode pattern, and breakout mode patterns have 50% chances of breakout on both sides. Because we are within a bear channel (as explained during last September report) the odds favors the bears.
- At $17235 there is the strong support from the weekly chart (bear flag measured move target); however, traders will also look to targets derived from the daily trading range. Nowadays, those targets are $13845 and $11780. As we can see, bears still have many reasons to sell.
- But, as we have been saying during the monthly reports, we are possibly at a buy zone on highest timeframes. Traders do not know when or where the bear inertia will stop, but they know that the market forces here are much more balanced than they seem.
- Because we stalled at resistances, we should expect lower prices and reach $17235 targets during the upcoming weeks.
Market analysis reports archive
You can access all weekend reports on the Market Analysis page.
Thanks Josep
You are welcome! We are glad to know that you enjoy this reading.