Market Overview: Bitcoin Futures
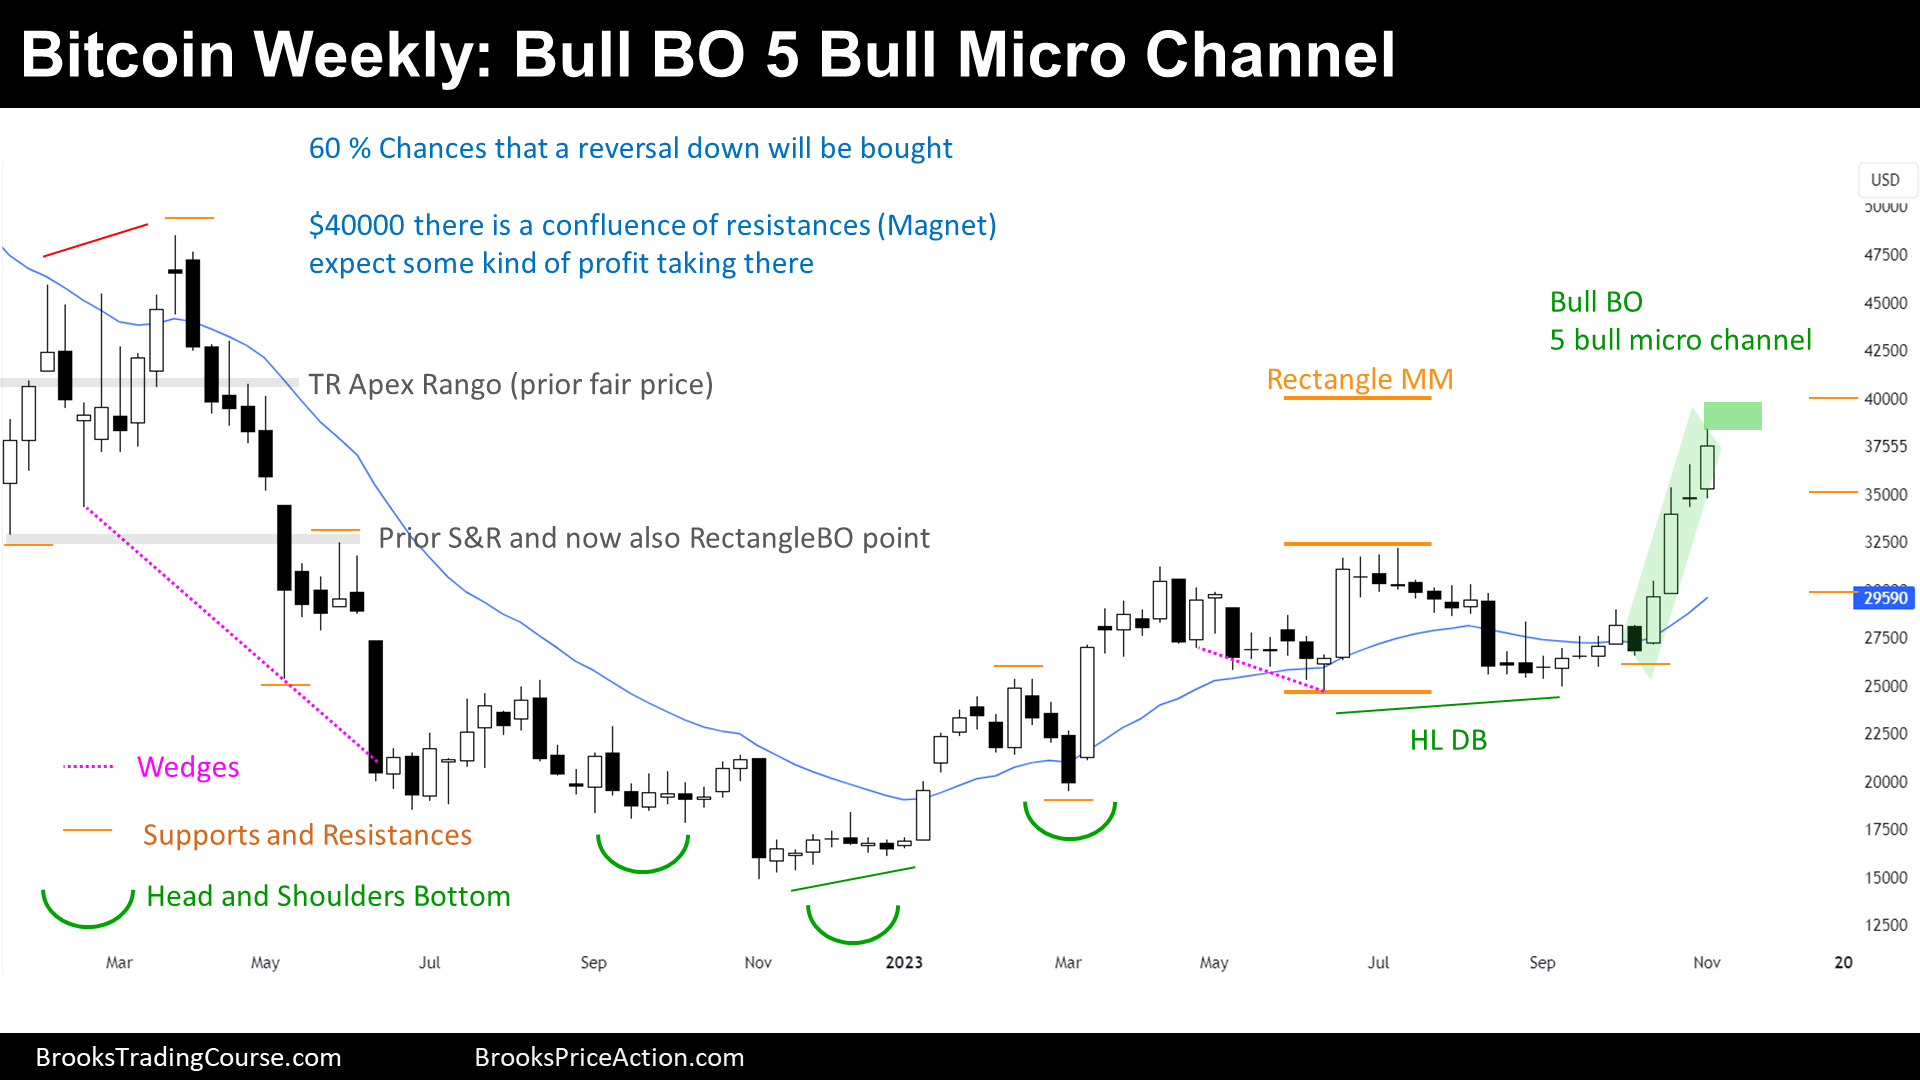
Bitcoin futures are Trading towards a Rectangle Measured Move and $40000. This week, the price closed higher 7.80% respecting the past week’s low. The Bull Breakout is evident, there are magnets close above that are probably going to be reached.
Bitcoin futures
The Weekly chart of Bitcoin futures

Past: Support and Resistances
- The price started a Strong Bear Channel:
- Bear Flag’s Breakout Point.
- Major Lower High.
- Then, failed a Breakout Below a Bear Flag and Reversed up, forming a HSB (Head and Shoulder Bottom) pattern, that broke up:
- 2022 Low.
- 2022s Major Higher Low.
- 2023 Major Higher Low.
- HSB Breakout Point
- HSB Measured Move around $35750 already reached.
- Lately, the price has been sideways creating a Double Top and a Double Bottom, which is a Trading Range, and because the Trading Range was not wide, was also a Rectangle and Breakout Mode Pattern.
- Trading Range High.
- Trading Range Low.
- Measured Move at $39500.
Present: Market Cycle
- The price reached the HSB Measured Move during the past week.
- There was some profit taking, since the price reversed down slightly after reaching the Target.
- This week, the price closed as a good bull bar, closing above its midpoint and the past week’s high.
Future: Inertia
- A bull breakout of a Breakout Mode Pattern (the Rectangle) has a 50% chance of leading to a swing trade, which means that the price might go towards $47000.
- After this week’s Bull Bar, the Bull Breakout of the Rectangle (or Breakout Mode Pattern, Trading Range…) it is evident. There is a 60% chance that the price is going to keep Trading higher.
- Probably, the price will get to $40000 big round number, where there is a confluence of resistances and hence, it is a magnet.
Trading
- Bulls:
- Some Bulls bought above the Rectangle’s high (Breakout Mode Pattern).
- Others bought a couple of weeks ago, above the first bull bar that closed above the Breakout Mode Pattern.
- Stop loss below the past week’s low is also ok
- There should be buyers below this week’s low.
Most bulls are placing their stops below the Breakout Mode Pattern. Still, there is a 40% chance that the price will reverse, and bulls might exit below a good bear bar closing around its low.
- Bears:
- They would rather not sell while the price is rising, and they will either wait for a bear signal bar for a failed bull breakout setup.
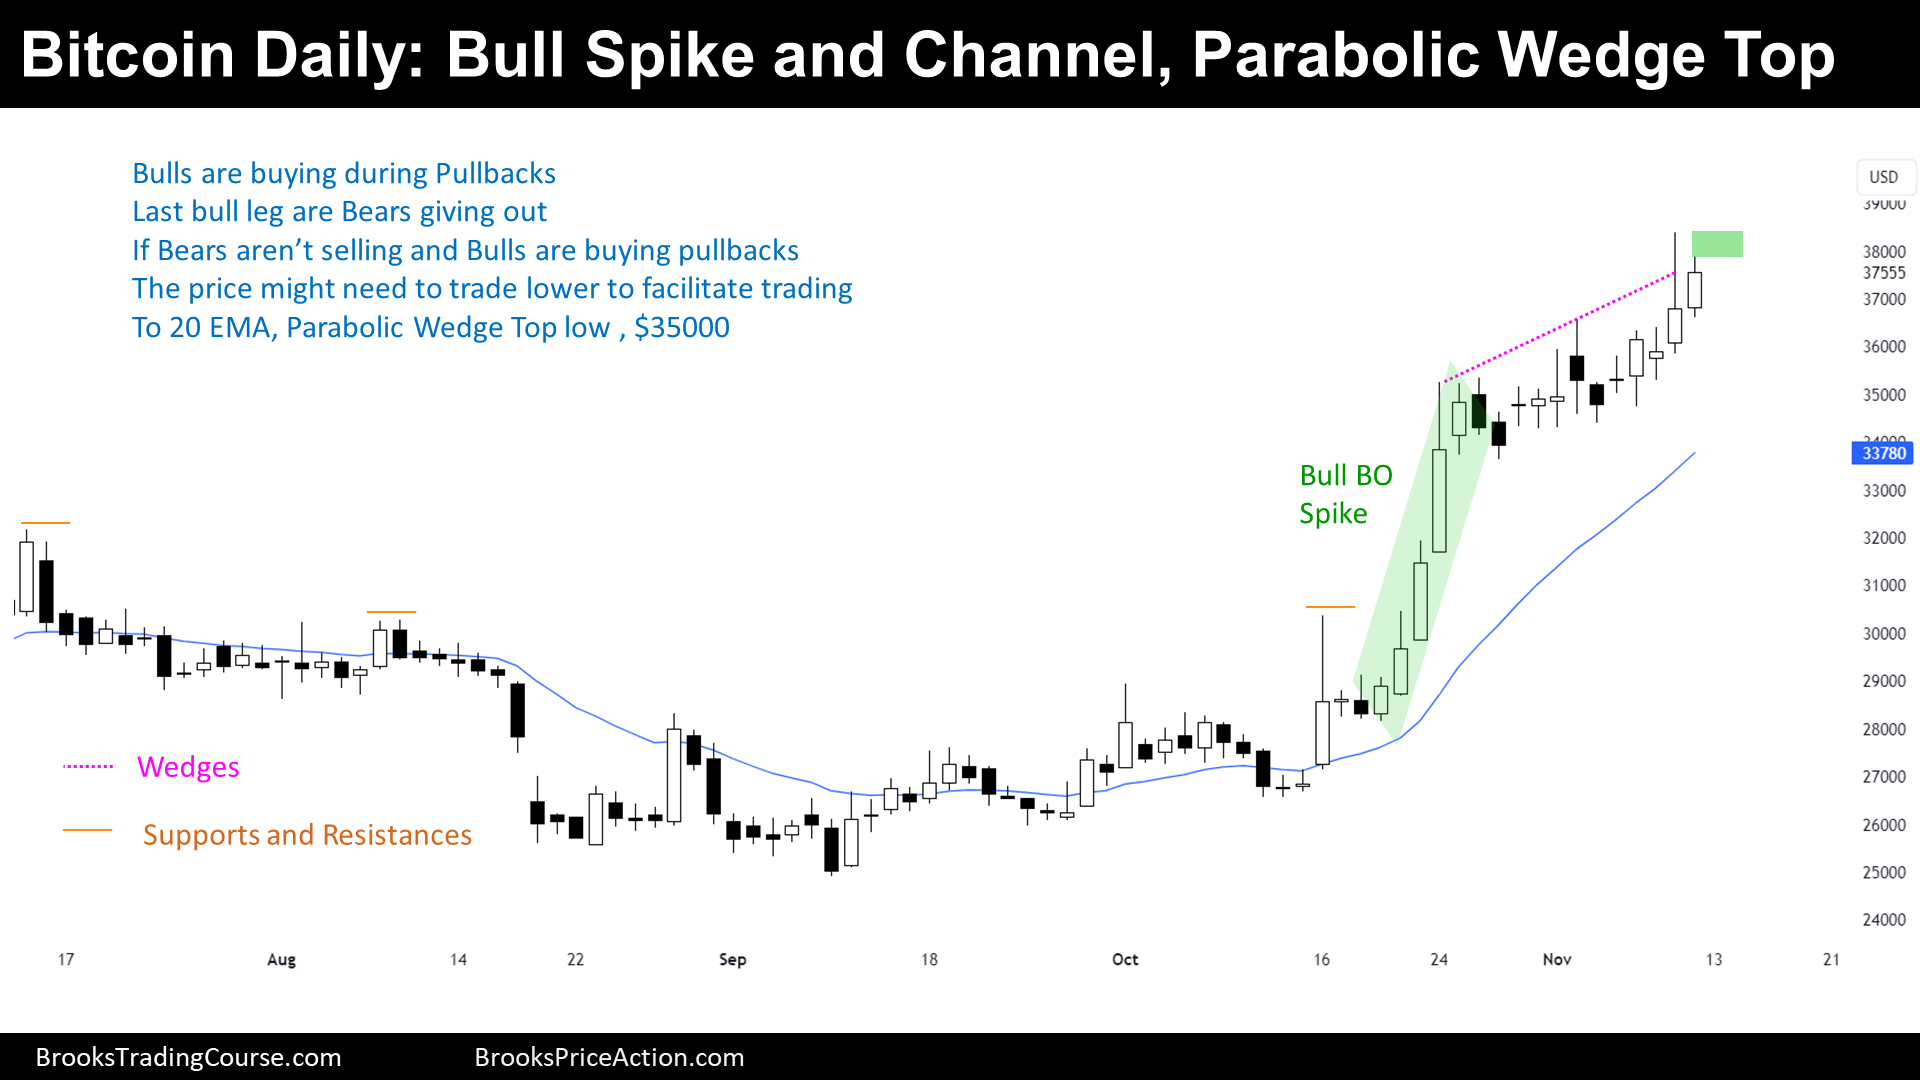
The Daily chart of Bitcoin futures

Past: Support and Resistances
- The price did a Bull Spike (Breakout) and Bull Channel.
- Breakout Points are now support.
- Bull Spike Low.
- Parabolic Wedge Top Low.
- 20-day Exponential Moving Average (EMA).
Present: Market Cycle
The current Market Cycle is a Tight Bull Channel, you can also call it a Bull Spike and Channel.
Future: Inertia
- 80% of attempts to reverse a Tight Bull Channel are going to fail; moreover, the price should Trade higher towards resistances.
- If there will be a bear reversal, the price will probably transition into a Trading Range first, that means, going sideways for at least 20 days.
- Or reach their targets.
- Weekly Rectangle’s Measured Move.
Trading
- Bulls:
- Buying far from the 20-day EMA is hard, most Traders buying high are trading with a small position size and are willing to buy more during a retracement.
- Bears:
- Those willing to sell are not expecting a swing down, but some scalps. For swing bears willing to sell, first, they will wait until there is a Trading Range and a topping pattern.
Market analysis reports archive
You can access all the weekend reports on the Market Analysis page.
Thanks again for a clear and informative price analysis, Josep. These weekly updates are incredibly valuable as a gauge for the week ahead and a reflection of the weeks past.