Market Overview: Crude Oil Futures
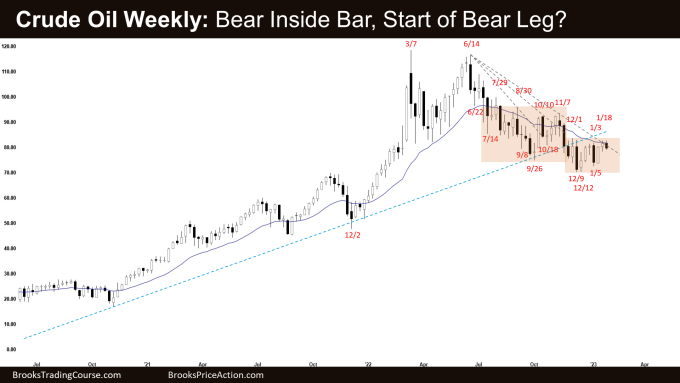
The Crude oil futures weekly candlestick was a Crude Oil bear inside bar sitting under the 10-week trading range high, 20-week exponential moving average and the bear trend line. Bulls need to break far above these resistances to increase the odds of higher prices. The bears want a retest and breakout below the December low.
Crude oil futures
The Weekly crude oil chart

- This week’s candlestick on the weekly Crude Oil chart was a bear inside bar closing near its low.
- We said that last week was a weaker buy signal bar, especially since it is sitting just under the 9-week trading range high, bear trend line and the 20-week exponential moving average.
- This week, Crude Oil appears to be stalling around these resistances.
- Previously, the bears got a reversal lower from a double-top bear flag (October 10 and November 7) breaking below the September low. However, they failed to get follow-through selling.
- Bears want another leg down breaking below the December low, completing the wedge pattern (the first two legs being Sept 26 and Dec 9).
- They hope that the last 10 weeks were simply forming a double-top bear flag (Dec 1 and Jan 18).
- The 20-week exponential moving average and bear trend line remain as resistances above.
- The bulls want a failed breakout below the September low and the bull trend line.
- They got another leg higher to retest the December high from a higher low major trend reversal (Jan 5).
- However, the bulls have not yet been able to break far above the 10-week trading range high, the 20-week exponential moving average and the bear trend line.
- The first breakout from an inside bar (last week) can fail 50% of the time. This remains true.
- Since this week was an inside bear bar closing near the low, Crude Oil is in breakout mode. Odds slightly favor a breakout below this week’s low.
- Traders will see if the bears can create a consecutive bear bar. If they do, it could be the start of the bear leg to test the bottom of the 10-week trading range.
- The last 10 candlesticks are overlapping sideways. That means Crude Oil is in a small trading range.
- Poor follow-through and reversals are more likely within a trading range. Traders will BLSH (Buy Low, Sell High) until there is a breakout from either direction.
- Crude Oil could be forming a trending trading range.
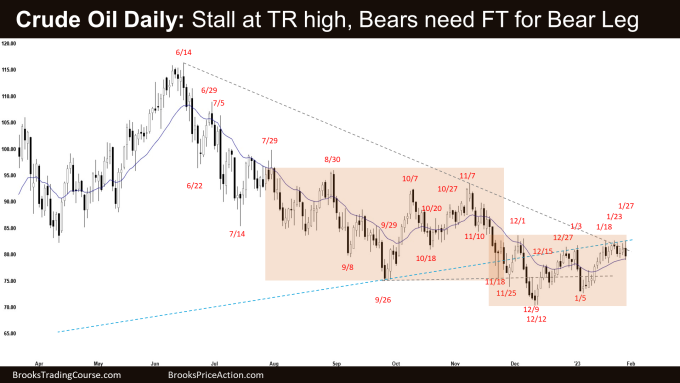
The Daily crude oil chart

- Crude Oil traded sideways to down for the week. Friday was a big outside bear bar.
- Last week, we said that the odds slightly favor Crude Oil to trade at least a little higher. Traders will see if the bulls can break far above the December high and the bear trend line, or if Crude Oil trades slightly higher but stalls and reverses lower.
- This week, Crude Oil is stalling around the 10-week trading range high.
- The bulls want a failed breakout below the September – November trading range and the major bull trend line.
- They want a reversal higher from a wedge bottom (July 14, Sept 26 and Dec 9) and a higher low major trend reversal (Jan 5).
- They see the move down from January 3 simply as a retest of the December low.
- While the move up since January 5 was strong, the bulls have not yet been able to create a breakout above the trading range high and the bear trend line.
- Crude Oil is in a 10-week trading range. Until the bulls can break far above the top of the trading range and the bear trend line, the current move up could simply be a bull leg within a trading range.
- The bears got a reversal lower from a double-top bear flag (Dec 1 and Dec 27) and a small double top (Dec 27 and Jan 3).
- However, they were not able to create follow-through selling.
- They hope that the current pullback (bounce) will stall around January 3 high and form a double-top bear flag (Jan 3 and Jan 18) or wedge bear flag (Dec 1, Jan 3 and Jan 18).
- They want a retest and breakout below the December low forming the wedge pattern with the first two legs being September 26 and December 9.
- This week formed a micro wedge (Jan 18, Jan 23 and Jan 27) and a micro double top (Jan 18, Jan 23).
- Since Friday was a big outside bear bar closing near the low, it is a good sell signal bar for Monday.
- Odds slightly favor Crude Oil to trade at least a little lower.
- If the bears get follow-through selling, it could be the start of the bear leg to test the 10-week trading range low.
- Because Crude Oil is in a trading range, traders will BLSH (Buy Low, Sell High) until there is a breakout from either direction.
- Poor follow-through and reversals are more likely within a trading range.
Market analysis reports archive
You can access all weekend reports on the Market Analysis page.
Can’t ask for much more than a good signal bar near the top (or bottom) of a well-defined trading range for a good trader’s equation.
Dear Andrew,
A good day to you..
Yeah.. agree with that..
One thing about trading range which I dislike, is the poor follow-through and constant reversals (choppy).. have to watch out for that..
Hope all is well there. Have a blessed week ahead.
Best Regards,
Andrew
I suspect if you want to take the trade you need to be able to scale in if the market tries to break out of the TR and then fails.
Yeah.. trade smaller, with wider stop..
Trading range can really test one’s patience..