Trading Update: Monday June 22, 2026 E-mini end of day video review S&P E-mini market analysis E-mini daily chart E-mini 5-minute chart and what to expect today Last Thursday’s E-mini setups Jed created the SP500 E-mini chart. Here are reasonable stop entry setups from last Thursday (before Friday US bank holiday). Chart shows each buy […]
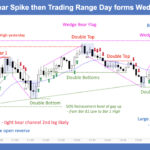
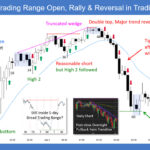
E-mini Bulls Taking Profits Betting on Pullback
Trading Update: Wednesday June 3, 2026 E-mini end of day video review S&P E-mini market analysis E-mini daily chart E-mini 5-minute chart and what to expect today Yesterday’s E-mini setups Jed created the SP500 E-mini chart. Here are reasonable stop entry setups from yesterday. Chart shows each buy entry bar with a green arrow and […]
E-mini Testing 7,200 Round Number
Trading Update: Friday April 24, 2026 E-mini end of day video review S&P E-mini market analysis E-mini daily chart E-mini 5-minute chart and what to expect today Yesterday’s E-mini setups Richard created the SP500 E-mini chart. Here are reasonable stop entry setups from yesterday. Chart shows each buy entry bar with a green arrow and […]
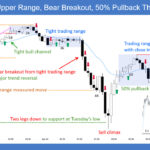
E-mini Sideways For Next Several Weeks
Trading Update: Thursday April 23, 2026 E-mini end of day video review S&P E-mini market analysis E-mini daily chart E-mini 5-minute chart and what to expect today Yesterday’s E-mini setups Richard created the SP500 E-mini chart. Here are reasonable stop entry setups from yesterday. Chart shows each buy entry bar with a green arrow and […]
Bitcoin Daily at Upper Third of Trading Range

Market Video Report: Bitcoin Duration 11:28 mins. Summary Bitcoin is facing a major bear trend or a major trading range. Within the report, we analyze the “Market Inertia” following a long-term bull trend and identify the key “Rule of Thirds” levels, targeting an equilibrium zone between $80,000 and $100,000, along with a specific trade setup […]
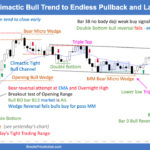
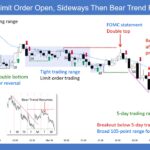
E-mini Bulls Looking to Buy Pullback
Trading Update: Thursday April 2, 2026 E-mini end of day video review S&P E-mini market analysis E-mini daily chart E-mini 5-minute chart and what to expect today Yesterday’s E-mini setups Richard created the SP500 E-mini chart. Here are reasonable stop entry setups from yesterday. Chart shows each buy entry bar with a green arrow and […]
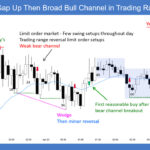
E-mini Testing November 2025 Low
Trading Update: Thursday March 19, 2026 E-mini end of day video review S&P E-mini market analysis E-mini daily chart E-mini 5-minute chart and what to expect today Yesterday’s E-mini setups Richard created the SP500 E-mini chart. Here are reasonable stop entry setups from yesterday. Chart shows each buy entry bar with a green arrow and […]
Bitcoin Weekly Doji at 2024’s Trading Range

Market Video Report: Bitcoin Duration 9:47 mins. AI is voicing Josep Capo’s original script. Summary Following a significant selloff last week, Bitcoin formed a weekly inside bar, signaling a period of market indecision. The lack of both a sharp reversal up or further bear continuation suggests that immediate volatility may subside. Based on current data, […]
Nifty 50 Trading Range and Inside Bar
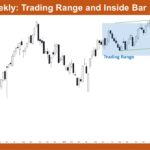
Market Overview: Nifty 50 Futures Nifty 50 Trading Range and inside bar on the weekly chart. The market this week had a strong bear close, but it is still trading inside a range. Because of this, traders can expect quick reversals, which also implies failed breakouts. On the daily chart, Nifty 50 has recently been […]
Bitcoin 50% Drawdown and reversal up from 2024 Trading Range Apex
Market Video Report: Bitcoin Duration 12:49 mins. Summary We have witnessed a decline of more than 20% over this week in Bitcoin and the price reached the 2024’s trading range apex. Now the price is deciding whether stay in that trading range area again or even test below $50000, or come back to $100000 area. […]

