Market Overview: Crude Oil Futures
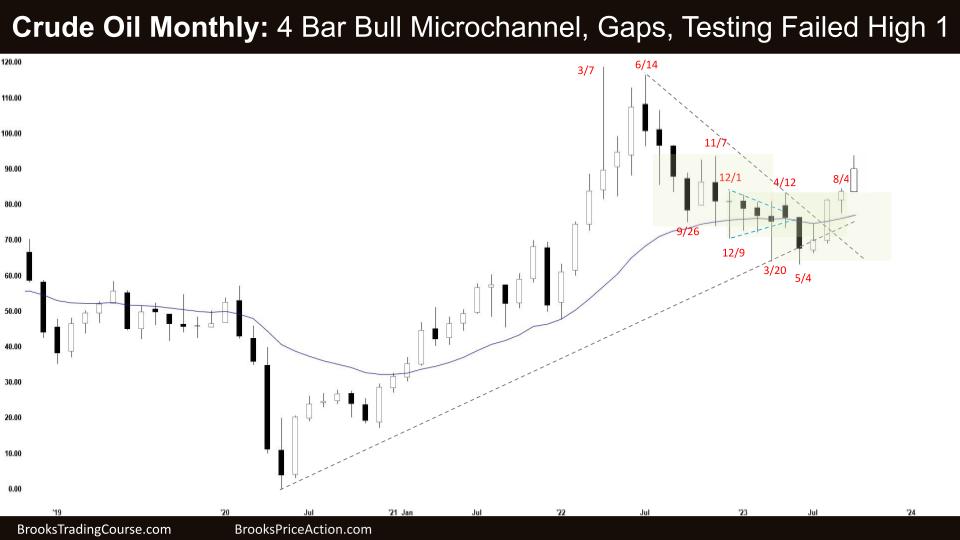
Crude oil futures moved higher with a strong bull bar with a tail above in a bull microchannel. There were buyers below the MA in a 20-bar MA gap buy setup. The inside bar got good follow-through, and now there are open bull gaps. The bears see it as a trading range and will sell where the High 1 bulls got trapped several months ago just above here.
Crude oil futures
The Monthly crude oil chart

- Crude Oil futures moved higher last month with a 4-bar bull microchannel.
- It was a breakout and follow-through above an inside bar below the MA.
- The bulls see a bull channel and a three-legged pullback to the MA. A High 2 or High 3 buy setup.
- But bulls were waiting for a good signal at the MA to continue, and they got it.
- The bears see a strong move down and a trading range, and now we are testing the failed High 1, which trapped bulls higher.
- The breakout is strong enough – 4 bull bars in a row – so that most traders will expect a second leg sideways to up. We will probably move back and test the prior bar’s high first.
- If open micro gaps stay below, the bulls can accelerate up from here.
- The bears see a tight trading range, and many dojis are just below where the price is, and the market will usually gravitate towards that so that they might fade this breakout.
- But there is no bear bar for them to sell above yet. The bears might also see we are near the breakeven price for any trapped bulls who bought the high close and who bought more two weeks ago.
- They need one more bar to get out without a loss. They will likely get that bar.
- Most traders should be long or flat.
- Expect sideways to up next month.
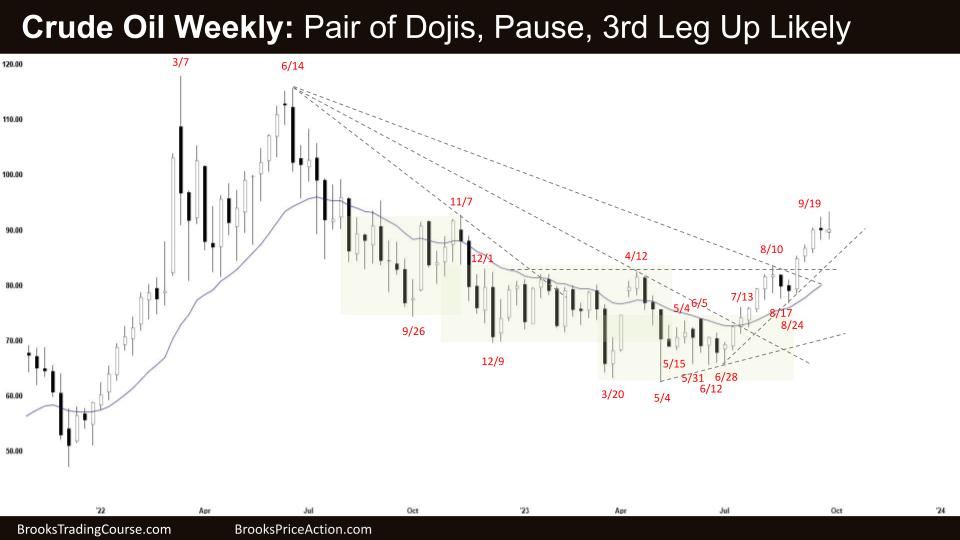
The Weekly crude oil chart

- Crude Oil futures moved sideways and closed a little higher with another doji.
- Technically, it is an outside bar, an expanding triangle on a lower timeframe.
- For the bulls it’s another strong bull leg, with open gaps below and they should get one more leg before a deeper, two-legged pullback.
- Dojis are a sign that a trading range might be forming already; this could be the middle of the final flag, and we might come back here.
- The bears saw a failed High 2 at the MA back in November last year, and the bulls got stuck there. We broke down lower and are now testing the top of this trading range.
- But bears need a sell signal to sell under or above. It is a bull bar, so more likely buyers below still.
- We have been in a trading range for over a year, so whatever breakout we have now will more likely become a leg in a trading range.
- Some bulls might wait for a test of the breakout gap below. But if you ever feel like you are waiting for a pullback, there is urgency, and you can buy small and add on later.
- Traders should expect at least one more bull bar to start off the next leg. If we pull back here for a few weeks, most limit order bulls will be trying to buy near the breakout point.
- We are always in long, and most bulls would need to see a strong bear close and to then trade below it to get out. Other bulls will see if the bears can get a scalp below any bar.
- If the bears cannot close that gap, it is a sign of strong bulls, and we can move higher quickly. It is a bull microchannel on the higher timeframe..
- There should be buyers below this bull outside bar.
- Most traders should be long or flat.
- Expect sideways to up next week.
Market analysis reports archive
You can access all weekend reports on the Market Analysis page.
To my eye the move up on the daily chart from the June HL looks stronger than the move down from last year’s high.