Market Overview: DAX 40 Futures
DAX futures was a small bear doji bar in a tight trading range. The bulls see the bull channel as continuing and will likely buy below at the MA. The bears have been unable to body gaps below so will not be willing to sell strongly yet. Most traders should be long or flat. Likely we test the new ATH again before traders decide where we are heading.
DAX 40 Futures
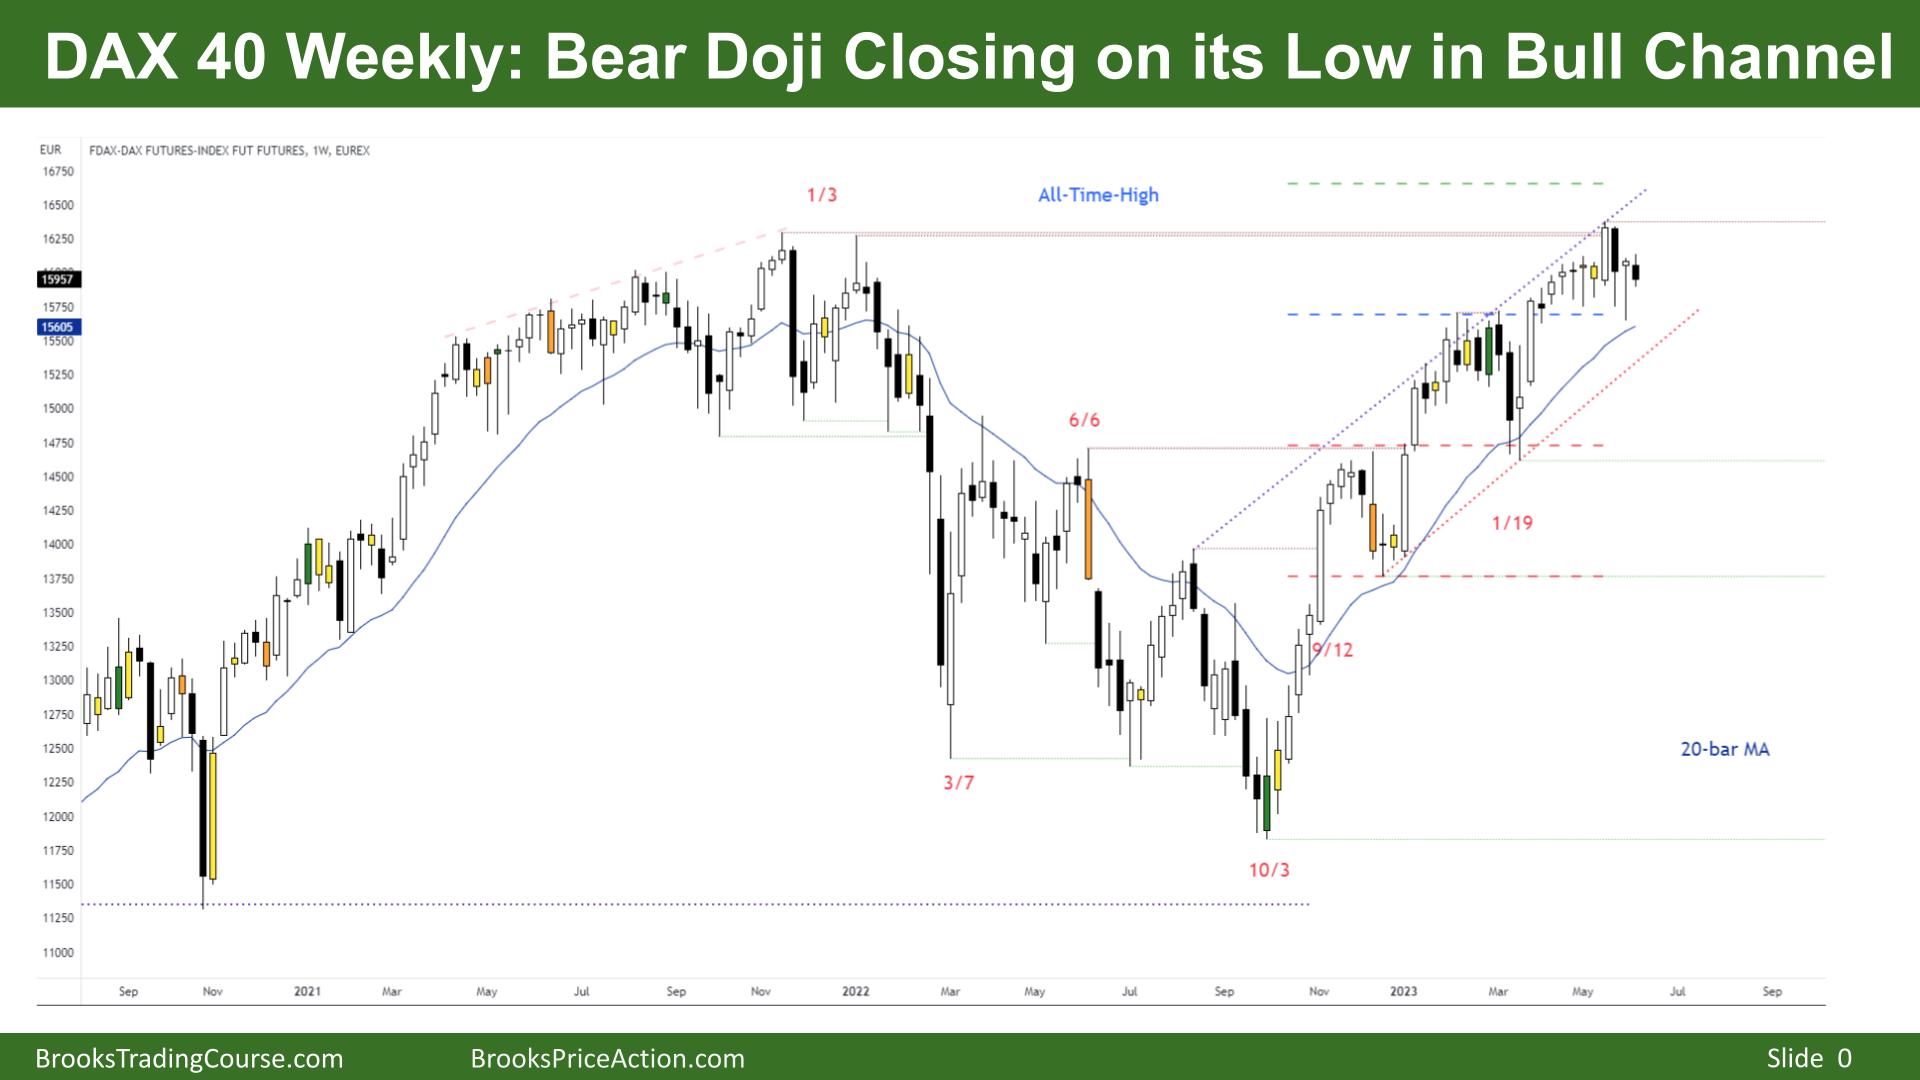
The Weekly DAX chart

- The DAX 40 futures was a bear doji closing on its low in a bull channel.
- We traded above last week, but there were only sellers there.
- The bulls see a tight bull channel with at least 3 pushes up. There is a measured move target above, but it is at a new ATH. We might be consolidating to get there.
- The bears see the bull channel as climactic and are looking for a wedge to sell the two legs down to the start of the third leg. But so far, no good sell signals have appeared.
- Some always-in bulls got out below the big bear bar two weeks ago. Others will stay in, but buy more at the MA, which is the prior BO point.
- There are at least two body gaps in this bull channel. When you have two gaps and one side is constantly failing to make money, you can call it a small-pullback trend. They can go on much longer than anyone expects.
- It is a bear doji bar, so a sell signal is below for next week. But for 9 weeks, traders bought at this price, so it is a low probability sell.
- Most traders should either be long or flat.
- A doji is not a good stop-entry trade; most traders should wait to enter.
- To sell the bears need to take out a trend line.
- We keep forming expanding triangles, which become buy signals at the new lows instead of sell signals.
- Bulls are buying pullback, so we will likely reach the MA soon. Some bulls are stuck above the ATH, which was a reasonable buy signal. Typically bulls can get out breakeven in an always-in BTC trend.
- Traders should expect sideways to up next week.
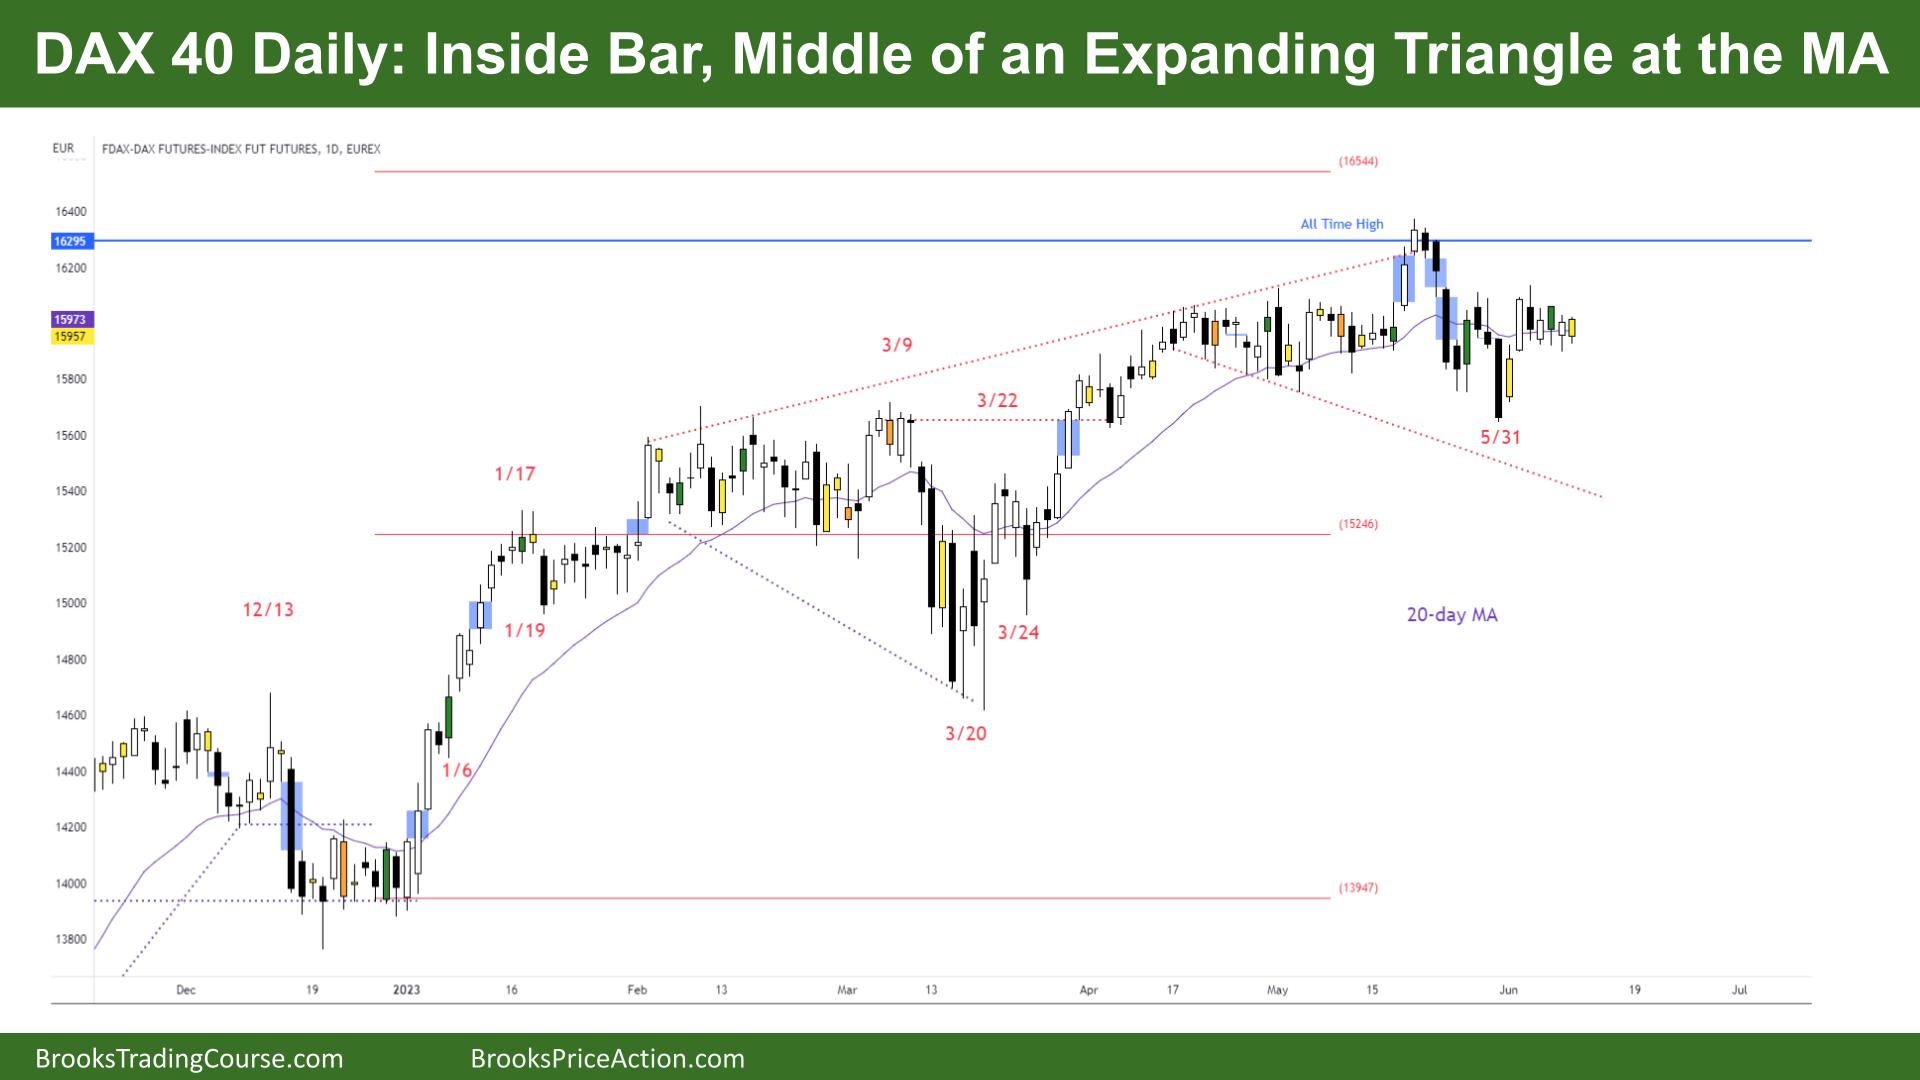
The Daily DAX chart

- The DAX 40 futures was a small bull inside-bar at the MA, in the middle of an expanding triangle. Find me a better definition of balance!
- Bulls see this as a final flag and want one more push-up above the ATH or to test the ATH.
- It is a bear doji on the HTF, and it looks like a triangle on this timeframe.
- Bulls bought the HTF buy signals, so they should be able to get out breakeven in a strong bull trend.
- Bears see we are at the top of a trading range but have lacked conviction selling. It is a bear doji on a HTF.
- The bears closed a gap on May 31st. But that only means there are sellers above the high of that bear leg. They were unable to find follow-through selling here.
- Most traders should not be trading the daily chart of this timeframe – either go up or down. This TTR price action is primarily for limit order traders who can scale in and manage their trades when surprised.
- There could be a failed High 2 setting up here, but it is an inside bar so a sell below at this stage is not high-probability either.
- The bears want another push down to break that prior swing low, but the best they can get is a trading range, most likely.
- Bulls want them to get trapped and run back up to their stops again.
- Most traders should be long or flat. The pullbacks are getting smaller, which could mean a climactic move up to end the trend.
- Bears want this to turn into an endless pullback – likely targeting the middle of the expanding triangle below.
Market analysis reports archive
You can access all weekend reports on the Market Analysis page.