Market Overview: DAX 40 Futures
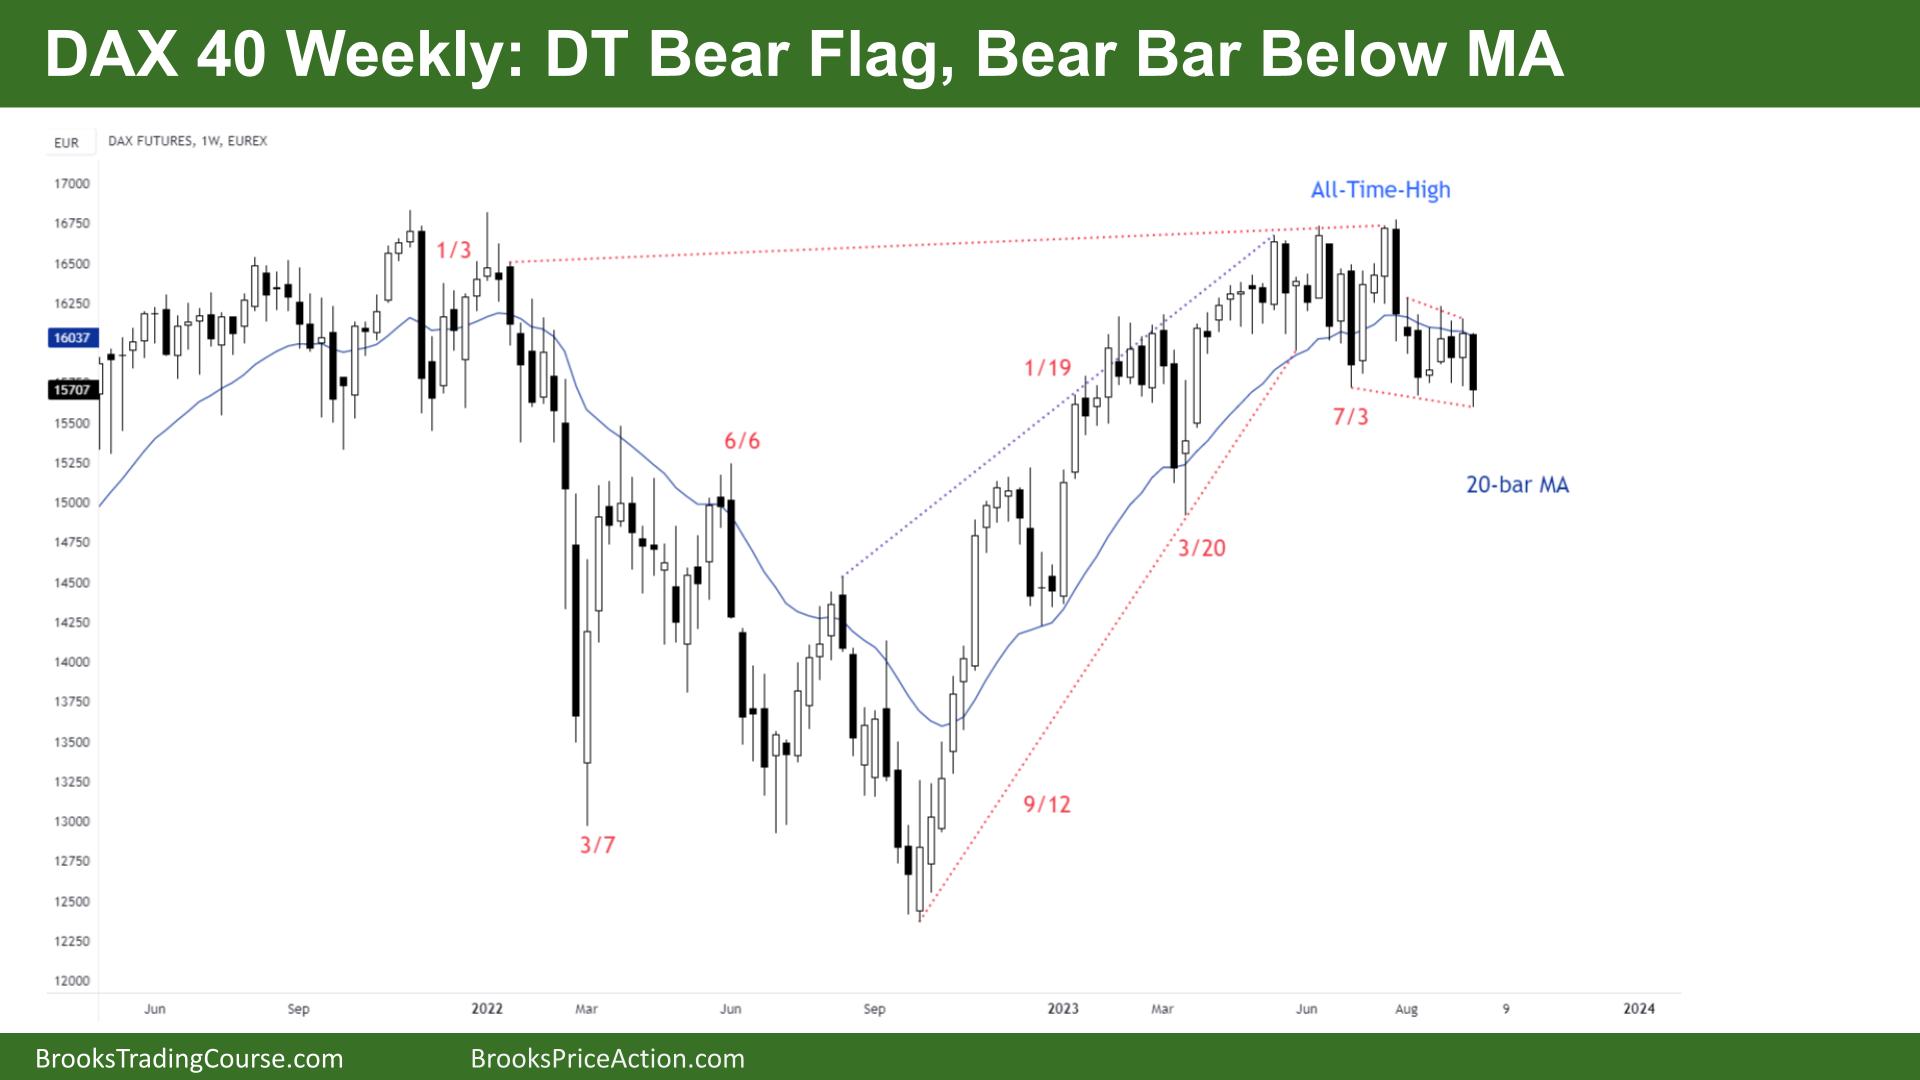
DAX futures moved back down last week with a bear bar below the MA, which could be a DT bear flag but more likely BOM. When the outside down bar got FT, it set a target below, which could give us one more bear bar. But the FT has disappointed bears, and the HTF bullishness could make us re-test the highs. Bears need one more bar to get always in short.
DAX 40 Futures
The Weekly DAX chart

- The DAX 40 futures last week was a bear bar, closing near its low and below the MA in what could be a DT bear flag.
- It is below the MA, but we’ve been sideways for many bars – so BOM. It has been BO mode since the bulls failed to get continuation – a BO and FT – above the ATH.
- But they set a new ATH, so the bull trend on the HTF is still in effect – even if it temporarily broadens into a TR.
- Expanding triangles are often continuation patterns, and the bulls already had 3 strong legs. Now that the sideways move is about 20 bars, you could argue the probability is about 50%.
- I would say 5% more for bulls because of the lack of closes below the MA by bears.
- Bears need consecutive closes below the MA to trigger the sell and always get in short. They broke a trendline, but usually, there is a test of the high before reversing.
- Some bears would argue that they already broke the TL and tested the high, and now we can move down, but with 7 weeks of sideways trading, that doesn’t look like anything strong.
- In February, the TTR broke down before flipping up. The bears could get a BO below for one bar and close that gap with February.
- If that gap doesn’t close – expect a test of the high close, ATHm high of 2022 area.
- If the gap closes, expect sellers to materialise out of nowhere in the top third of this expanding triangle.
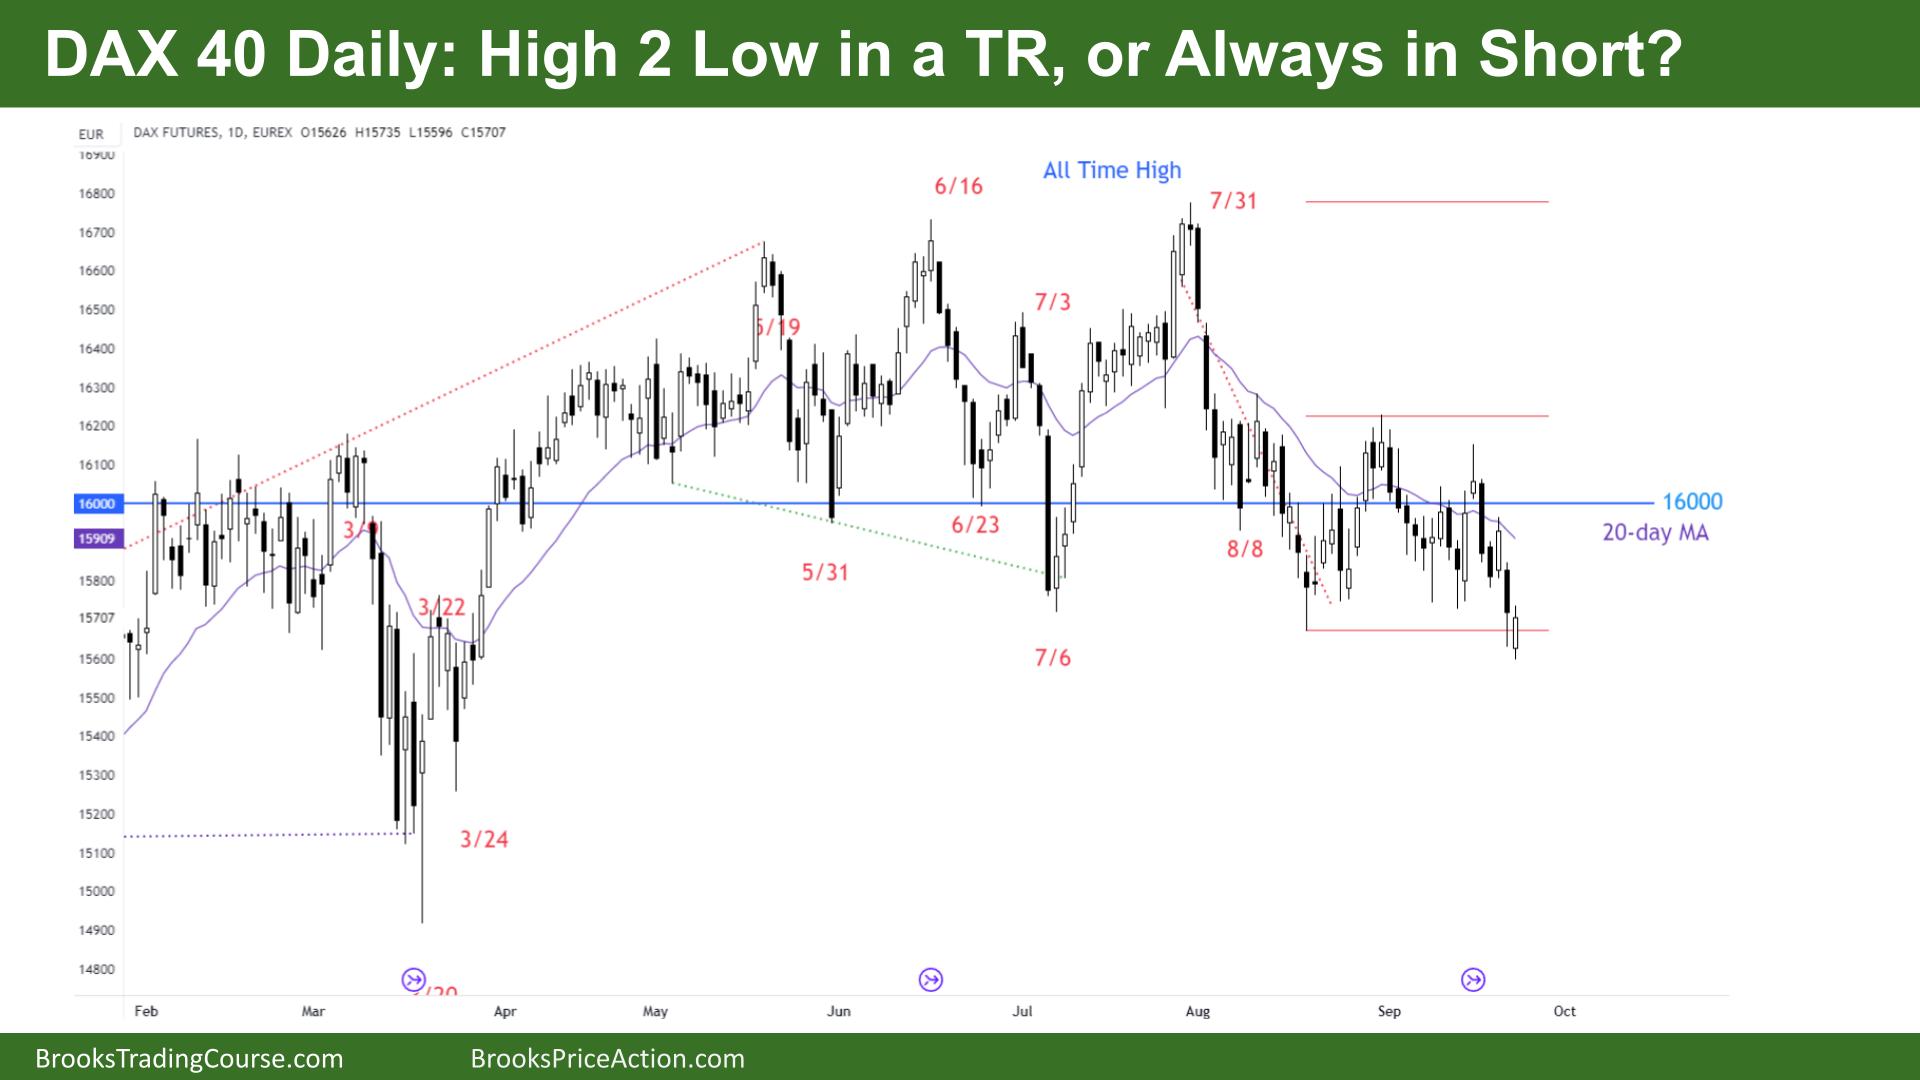
The Daily DAX chart

- The DAX 40 futures on Friday was a bull bar closing near its high low in a TR.
- It’s a credible DB and a decent buy signal, and if we trade above, it is a reasonable high 2. But did we go always-in short?
- Most traders should have a second position to buy somewhere below that bar, as trading ranges have a naughty habit of going above and below swing points.
- Bears are in a strange position because of the gap to sell below a bull bar low in TR. Tricky!
- The bulls might see a wedge bottom, the bears a wedge top – but it’s easier to blur the eyes and see a large expanding triangle and now a volatility contraction.
- The bulls want the MM up from a break above the DT.
- The bears want the MM down from a break below the DB.
- Expect both traders to be disappointed.
- It is a DT bear flag on the HTF so daily bears want to change the tone.
- It is technically a bear microchannel from Wednesday, so the first reversal up should be minor. I’m expecting a LL before a move-up.
- The bulls didn’t get consecutive bull bars above the MA before, which was disappointing, and some bulls are trapped there, so we might bounce back off the underside of the MA as they break even.
- 16000 has been important for a long time, and I’m expecting us to oscillate around it further. So the further we are from it, the better the mean-reversion trade gets back to it.
- The bulls see that the bears who sold below the MA got stuck in the prior week, so they got out on Friday. Only the 16000 swing bears are still in, which could give us one more bar down before their target.
- Expect sideways to up next week.
Market analysis reports archive
You can access all weekend reports on the Market Analysis page.
Thank you Tim, I always appreciate your input.
There is a discrepancy of Friday’s bar as well as the bar from 20 Sep between TradeStation and CQG. Your chart looks the same as my TradeStation chart but on CQG the 2 bars are dojis closing below their midpoint. Looking at the 5 minute chart supports how the bars look on CQG.
Do you have any idea why TradeStation and your chart would show a bar which does not reflect the OLHC of the 5 min chart? Which daily bar do the institutional traders see?
On the daily chart, I think we are still AIS since 2 August, I do not see an indication making the market AIL as of yet. But as the market is at support it is not ideal to enter short.