Market Overview: Weekend Market Analysis
The SP500 Emini futures contract is in a parabolic wedge buy climax. There is also a streak of 11 bull days and an 11-day bull micro channel. This should attract profit taking within a couple weeks.
The EURUSD Forex weekly chart is turning up from a wedge bull flag. However, the rally is probably just a bull leg in a 9-month trading range.
EURUSD Forex market
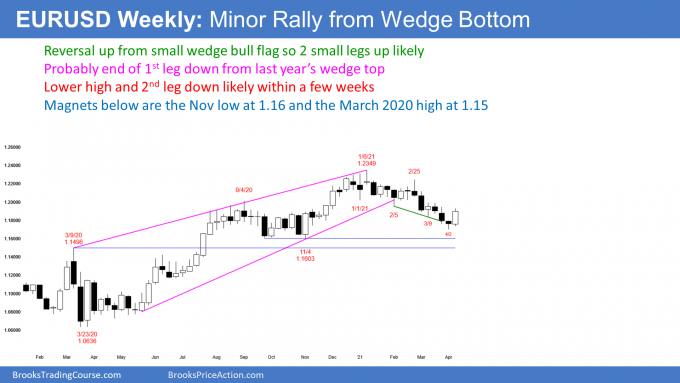
The EURUSD weekly chart has strong 2-week rally in 9-month trading range

- Big bull bar this week after wedge bottom 2 weeks ago.
- There are 2 wedges on the weekly chart. Last year formed a yearlong wedge top. The selloff from that wedge top formed a 3-month wedge bottom.
- Wedge reversals typically have at least 2 legs.
- The 1st leg down from last year’s wedge top ended 2 weeks ago. That 1st leg down was a wedge bottom.
- The 2-week rally is a pullback from the 1st leg down from last year’s wedge top. A 2nd leg sideways to down should begin within about a month.
- The 2-week rally is also the 1st leg up from the 3-month wedge bottom.
- The 2nd leg down from last year’s wedge top will probably be the pullback from the 1st leg up from the March wedge bottom. There should then be a 2nd leg up.
- Since multiple reversals are likely, the trading range that began in August should continue for at least a couple more months.
- 40% chance that the 2-week rally is a resumption of last year’s bull trend, and there will not be a 2nd leg sideways to down, to the November 4 low from last year’s wedge top.
S&P500 Emini futures
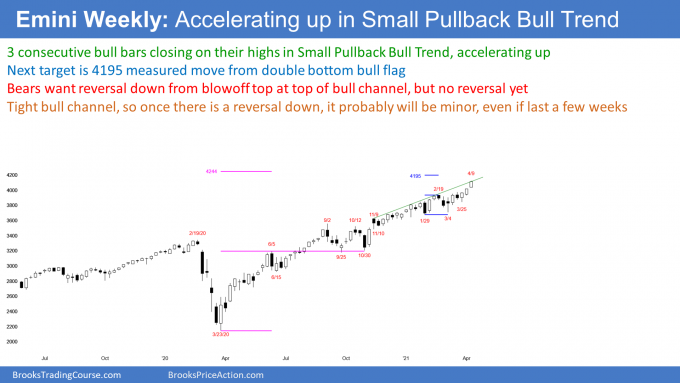
The Weekly S&P500 Emini futures chart is accelerating up to top of channel

- Yearlong tight bull channel (Small Pullback Bull Trend), which is very strong bull trend.
- 3 consecutive bull bars closing near their highs, so accelerating up to top of bull channel.
- Acceleration up late in a bull trend usually attracts profit takers.
- This increases chance of a 2- to 3-week pullback beginning at any time.
- First reversal down in Small Pullback Bull Trend is typically minor. That means 70% chance it would lead to a bull flag, or a trading range (like in September and October last year). Only a 30% chance that it would reverse abruptly down into a bear trend (the March 2020 bottom was an example of an abrupt reversal up without a 2nd leg down).
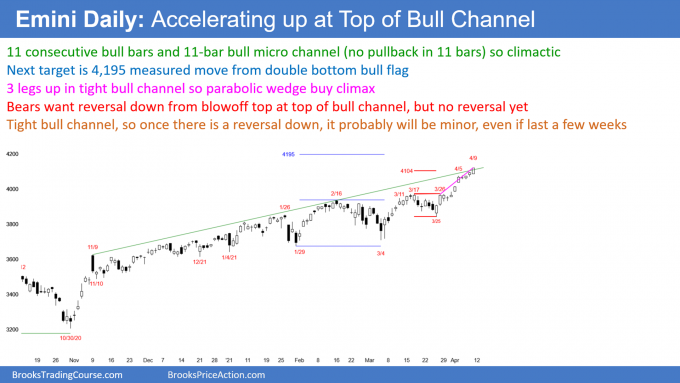
The Daily S&P500 Emini futures chart is in extreme buy climax

- 3 legs up in tight bull channel over past 3 weeks is a parabolic wedge buy climax, which usually attracts profit takers.
- Streak of 11 consecutive bull trend days is unusual, and therefore climactic.
- 11-bar bull micro channel (every low above low of prior day) is unusual, and therefore climactic.
- Climaxes attract profit takers because stop becomes far away, which increases risk. Easiest way to reduce risk is to reduce position size by taking some profits.
- Climaxes can last much longer than what might seem reasonable. When the profit taking begins, it can be fast as bulls exit in a panic. It will probably begin in April.
- For example, the buy climax in January 2018 lasted a month. There was a 10% correction over the next couple weeks.
- The buy climax from the May 22, 2020 low lasted 12 days, and ended with a 9% correction one week later.
- The September 2 buy climax lasted 10 days, and ended with a 10% correction over the next 3 weeks.
- After all 3 reversals, the bull trend resumed. The bulls will buy the 1st 10% selloff this time as well.
- Once the profit taking begins, there is a 50% chance there will be about a 10% pullback, and a 30% chance of a 20% pullback.
- This buy climax is unusually extreme on the daily and weekly charts. At some point, the bulls will take some profits.
- Since the buy climax is as extreme as it is, the Emini might go sideways for many months before the bulls will be willing to buy aggressively again.
- Even if a reversal down is only about 10%, it might take many months for the Emini to make a new high. Consequently, the Emini might soon form the high for the year, or at least until late in the year.
Trading Room
Traders can see the end of the day bar-by-bar price action report by signing up for free at BrooksPriceAction.com. I talk about the detailed Emini price action real-time throughout the day in the BrooksPriceAction.com trading room. We offer a 2 day free trial.
Charts use Pacific Time
When I mention time, it is USA Pacific Time (the Emini day session opens at 6:30 am PT, and closes at 1:15 pm PT). You can read background information on the intraday market reports on the Market Update page.