Trading Update: Wednesday November 1, 2023
S&P Emini pre-open market analysis
Emini daily chart
- The Emini formed a 2nd consecutive bull breakout bar, closing above its midpoint yesterday. The bulls see the consecutive bulls bars as strong enough to get a second leg up likely.
- The target for the bulls is the October 3rd breakout point low. This is because the daily chart is in a bear channel, and the prior breakout point lows have closed. Trends typically get weaker as they progress, which means the odds favor the market going above the October 3rd low and allowing the bulls to make money.
- The bulls have the argument that the bears failed to break below the bottom of the bear trend channel line (August 18th, October 3rd, and October 27th). This increases the odds of a test of the top of the channel, which is currently near 4,350.
- If the bulls manage to get an upside breakout, traders will see a test of the top of the bear trendline as being imminent.
- The bears want the market to continue the trend, forming lower highs and lows. More likely, the daily chart is in a trading range, and the bear channel will evolve into a trading range.
- Today is an FOMC day, and traders will wonder if the FOMC report will drive the market up to the October 3rd low.
- Overall, the daily chart will probably test 4,300 in the next week or two.
Emini 5-minute chart and what to expect today
- Today is an FOMC day, which means traders should be prepared for a lot of trading range price action leading up to the report.
- Traders should stop trading at least 45 minutes before the report is released. Otherwise, if a trader trades up into the report’s release, they risk getting trapped and being forced to close the trade for a loss right before the report.
- Once the FOMC report is released, a trader should wait for two closes after the report before placing a trade. FOMC report bars often have big breakout bars that are followed by reversals. So, waiting for two bars to verify the breakout is getting follow-through is better.
- FOMC events increase the volatility dramatically. There is nothing wrong with not trading FOMC events. Low-probability events typically have a higher probability compared to normal market conditions.
- This means that it is reasonable to consider the afternoon off on days with FOMC reports. FOMC days are fun. However, they will not be the single determining factor on whether a trader is profitable.
- If a trader decides to trade the FOMC, they should consider trading with 20% of their normal position size. This ensures they are trading appropriately small, compared to the risk.
- As always, most traders should consider waiting for 6-12 bars before placing a trade. Reversals are common on the open, and it is best to avoid them unless one is excellent at limit order trading, which requires quick decisions.
- Most traders should try and catch the opening swing that often begins before the end of the second hour. It is typical for the opening swing to start after the formation of a double top/bottom or a wedge top/bottom.
Yesterday’s Emini setups

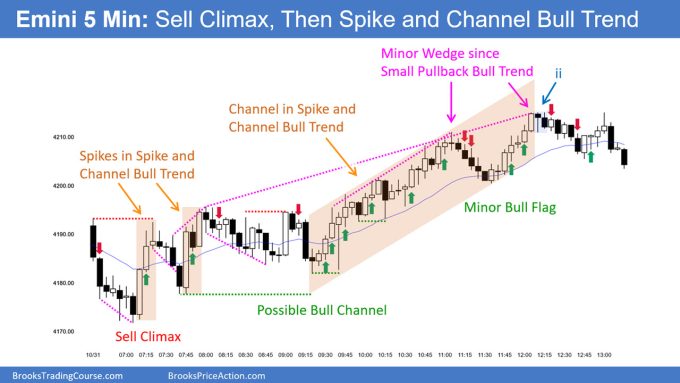
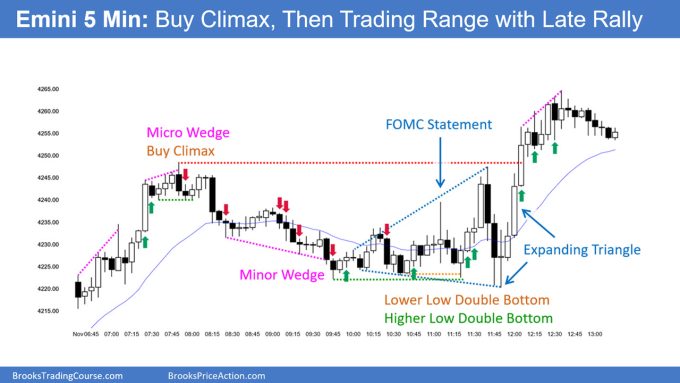
Al created the SP500 Emini charts.
Here are reasonable stop entry setups from yesterday. I show each buy entry bar with a green arrow and each sell entry bar with a red arrow. Buyers of both the Brooks Trading Course and Encyclopedia of Chart Patterns have access to a near 4-year library of more detailed explanations of swing trade setups (see Online Course/BTC Daily Setups). Encyclopedia members get current daily charts added to Encyclopedia.
My goal with these charts is to present an Always In perspective. If a trader was trying to be Always In or nearly Always In a position all day, and he was not currently in the market, these entries would be logical times for him to enter. These therefore are swing entries.
It is important to understand that most swing setups do not lead to swing trades. As soon as traders are disappointed, many exit. Those who exit prefer to get out with a small profit (scalp), but often have to exit with a small loss.
If the risk is too big for your account, you should wait for trades with less risk or trade an alternative market like the Micro Emini.
EURUSD Forex market trading strategies
EURUSD Forex daily chart
- The EURUSD retested the October 23rd close yesterday. However, there were more sellers at this price level, and the market sold off, forming a bear reversal bar.
- The bears are hopeful they will get strong follow-through selling today and test the October low.
- They hope buyers will be near the October 13th higher low. Next, the bulls will try to get a higher low double bottom, a major trend reversal.
- Overall, traders will pay close attention to the follow-through today and tomorrow to see how determined the bears are to break below the October low. More likely, the market will continue to go sideways.
Summary of today’s S&P Emini price action

Al created the SP500 Emini charts.
End of day video review
End Of Day Review will be presented in the Trading Room today. See below for details on how to sign up.
See the weekly update for a discussion of the price action on the weekly chart and for what to expect going into next week.
Trading Room
Al Brooks and other presenters talk about the detailed Emini price action real-time each day in the BrooksPriceAction.com trading room days. We offer a 2 day free trial.
Charts use Pacific Time
When times are mentioned, it is USA Pacific Time. The Emini day session charts begin at 6:30 am PT and end at 1:15 pm PT which is 15 minutes after the NYSE closes. You can read background information on the market reports on the Market Update page.
Hi
Why bar 25 in oct 31 is not a buy stop entry?
Since I thought
BLBC, at MA, H3, HL and AIL??
Hello
I have a few questions about the stop entries on October 31
Why Al did not specify the entry point for bar 11, 13, 14?
Because I thought it was a DT with bar 1 and a LH MTR with bar 71 Y?
Since the MTR setups on the open can be smaller…
Hello, I was wondering if the Nov.1st Free Day Webinar was recorded and will it be available for reviewing later on? It was a great opportunity and would be greatly appreciated if it is possible to be able to watch it again. Thanks.
Yes, as written in several places the videos will be put on the “Learn to Trade/Trading Room” page early next week.
Today, November 1, bar 12 can’t be an entry bar because it’s an inside bar.
Al must be using entry 1 tick above close of signal bar rather than 1 tick above high, so entry works.
The entry bar becomes an inside bar after it closes but you would already be in trade before then.
The arrows do not make it easier to read the entries when it is unclear if it is BTC or BA. I know it is a bit of an experiment to see if it works in a book without colors, but a chart with colored rectangles for entries is easier and faster to read.
Hi Willem.
Do you not have the exact same arrow marker placements for entries on your trading platform?
Trade markers are placed above and below entry bars. Otherwise would be clearly confusing if placed above/below signal bars.
Buy The Close or buying above is your call. No need for too much detail on these charts. We all trade a little differently.
Could I get some clarity in what is meant by ‘and the prior breakout point lows have closed.’ What closed? A gap?
Why not sell below 13
Late. Half way down, middle of opening trading range, 50% pullback from a strong bull move. Just my 2 cents.
Thanks admin