Trading Update: Tuesday May 17, 2022
Emini pre-open market analysis
Emini daily chart
- Emini yesterday was a doji bar following Friday’s entry bar. This is disappointing for bulls and a sign of trading range price action. The market is getting near the bottom of the 3-month trading range (February – April) and will likely test the May 2 low today or tomorrow.
- Yesterday’s doji is very close to May 2 low, an important magnet. It is the bottom of the trading range and a logical area for bulls to take profits. Some bulls who were disappointed by the selloff down to May 12 would take profits early just in case the market did not reach the May 2 low.
- The reversal up from May 12 is strong enough that the odds favor at least a small second leg up.
- The bears hope the current rally will form a double top around the May 2 low and keep the May 2 gap open. This would increase the odds of the market needing to fall below the May 12 low.
- Overall, the market will likely have to rally for a couple of legs and reach the May 2 high and possibly the May 4 high before the bears have a chance at a second leg down.
- The bears want to prevent the bulls from getting a strong reversal up. The bears hope to get a lower high below March 29 that will test below May 12.
- Traders should expect sideways to up over the next few days.
- Another note is that the market will probably have to go above the high of last week’s 4,069 and trigger the stop entry buy on the weekly chart.
Emini 5-minute chart and what to expect today
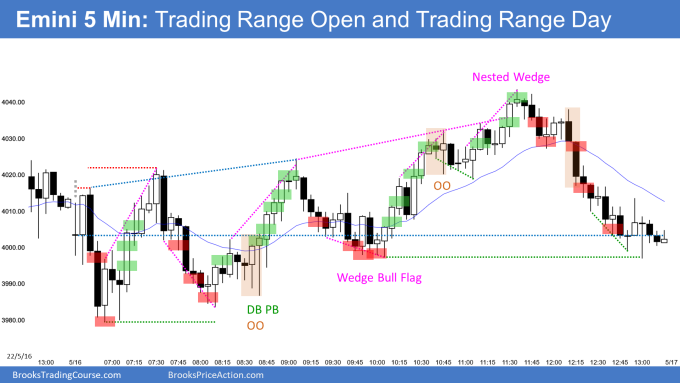
- Emini is up 65 points in the overnight Globex session.
- The bulls got a strong breakout during the overnight Globex session and the early morning session.
- The U.S. day session will gap up today.
- At the moment, the Globex market is at the May 2 low and will likely stay around this price during the U.S. day session. The bulls want today to close above the May 2 low as a sign of strength by the bulls.
- The bears want to undo the damage the bulls have caused by creating a bear trend day and reversing the gap (assuming we get one).
- The market will gap up, which means traders should expect a pullback to the moving average before there is a swing trade as the highest probability. This means traders should expect a trading range open.
- Since there will be a gap up, this increases the odds of the market having a bull trend day today.
- As usual, traders should wait for a credible stop entry or strong breakout with follow-through before trading.
Yesterday’s Emini setups

Al created the SP500 Emini charts.
Here are several reasonable stop entry setups from yesterday. I show each buy entry with a green rectangle and each sell entry with a red rectangle. Buyers of both the Brooks Trading Course and Encyclopedia of Chart Patterns have access to a much more detailed explanation of the swing trades for each day (see Online Course/BTC Daily Setups).
My goal with these charts is to present an Always In perspective. If a trader was trying to be Always In or nearly Always In a position all day, and he was not currently in the market, these entries would be logical times for him to enter. These therefore are swing entries.
It is important to understand that most swing setups do not lead to swing trades. As soon as traders are disappointed, many exit. Those who exit prefer to get out with a small profit (scalp), but often have to exit with a small loss.
If the risk is too big for your account, you should wait for trades with less risk or trade an alternative market like the Micro Emini.
EURUSD Forex market trading strategies
EURUSD Forex daily chart

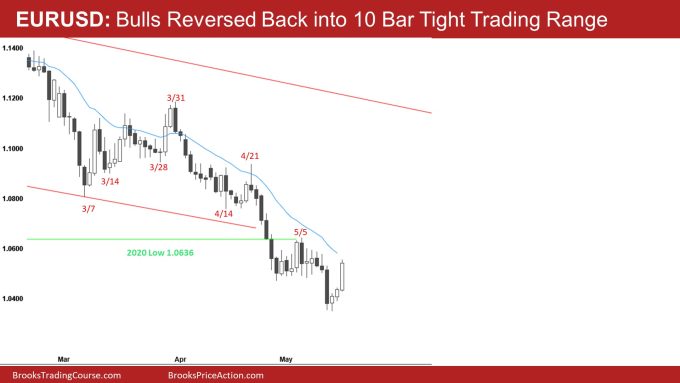
- The bulls had a strong rally during the overnight session. The market is now above the May 12 high and back into the 10-bar tight trading range.
- As I said in the prior blog post, the odds favored a failed bear breakout below the 10-bar tight trading range, which is what is happening right now.
- The reversal up is setting up a final flag on the daily chart, and the bulls hope this will give them enough energy to break above the May 5 high.
- The next target for the bulls would be the bottom of the March – April trading range.
- The bulls have a breakout just under the 20-bar exponential moving average, which will be resistance.
- Traders will pay close attention to how today’s bar closes. Will it close as a strong bull bar closing near its high, or will it have a big tail on top, indicating selling into the close.
- If today closes on a high, traders will be eager to see if tomorrow is a strong follow-through bar as well. This would increase the odds of the market becoming always in long and increase the probability of higher prices.
- Overall, today will be an important bar for the bulls and bears.
Summary of today’s S&P Emini futures price action and what to expect tomorrow
- Al will post chart after the close.

Al created the SP500 Emini charts.
End of day summary
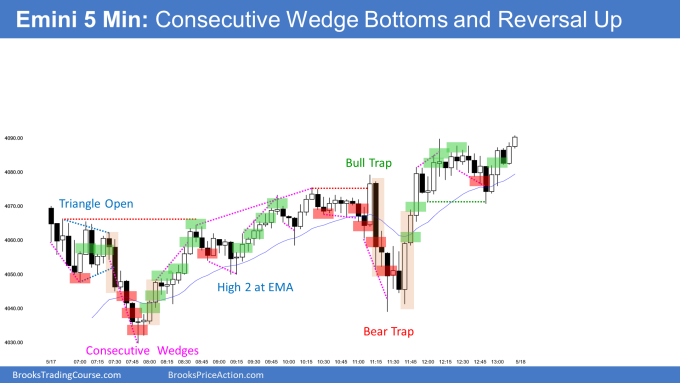
- Today was mostly a trading range that was sloped up (broad bull channel). On the open, the market formed consecutive wedge bottoms around 7:45 PT. When you get consecutive bottoms on the open, there is an increased risk of the market reversing up.
- The market also tested a 50% pullback of today’s open to yesterday’s close. This was likely to be a support level.
- The market formed a triangle during the first hour of the day.
- The bears got a breakout around 7:30 PT, but the follow-through was bad, which increased the odds of an opening reversal.
- The bulls rallied back to the open of the day and went sideways going into the report.
- The big bear breakout bar around 11:15 PT was big, but it had a big tail below, which increased the odds of breakout failing.
- The follow-through after 11:15 PT was bad for the bears, and the market reversed up during the final hour and closed on its high.
- Today was a good bar for the bulls on the daily chart. Although the body was weak, the bulls managed to close above the May 2 lows, which is a sign of strength for the bulls.
See the weekly update for a discussion of the price action on the weekly chart and for what to expect going into next week.
Trading Room
Traders can see the end of the day bar-by-bar price action report by signing up for free at BrooksPriceAction.com. Al talks about the detailed S&P Emini futures price action real-time throughout the day in the BrooksPriceAction.com on trading room days. We offer a 2 day free trial.
Charts use Pacific Time
When times are mentioned, it is USA Pacific Time. The Emini day session charts begin at 6:30 am PT and end at 1:15 pm PT which is 15 minutes after the NYSE closes. You can read background information on the market reports on the Market Update page.
Thanks Brad for the report. The nested wedge on S&P – could you explain that a bit more please? Are there 4 smaller wedges in the main big wedge? Sorry if I am being dim!
Thanks
James
I am not sure which Wedge you are referring to. Can you give me some more details?
Sorry I was referring to Monday 16 May chart – I’ve posted same question there to keep things tidy. Apologies for the confusion.
Hi James, if I may comment, yes, the smaller wedges are inside the larger wedge, thus they are termed “nested”. A nested wedge top near a larger wedge top increases the probability of a profitable short trade.
Thanks Graeme appreciate your input.
Thanks for the report Brad.
Just a question regarding the trading day –
Beginning swing traders using stop entries, how should they navigate during the phases as exhibited by the markets during 11 am to 12 noon today? Would it be a good idea to shift to 3 minute charts for the time such increased volatility persists?
The bull trap triggered my sell stop, generated the sell signal again which was too late. The market turned AIS and then back to AIL within a few bars.
Sadly it wasn’t even a 2nd leg bear trap(or at least didn’t appear to be one), unless you consider the bull trap to be the PB from the first leg following the wedge sell signal.
I would certainly not switch to a smaller timeframe due to confusion on the 5-minute chart. At times, you will hear Al discuss trading the 2-3 minute chart. He is using the smaller time frame to get an earlier entry. However, he already knows what he is trying to do based on the 5 minutes. For example, if the 5-minute is in a strong bull breakout, he may look at a 2-minute chart and find a H2 pullback. (if this does not make sense, let me know, and I will explain further).
As far as 11:15 PT, the bear breakout bar was moving fast, so the worst thing one can do is react because they are worried about missing a move. The problem with the big bear bar breakout bar at 11:15 PT is the risk of the bar. It is almost 20 points and forces one to sell in the middle of the day’s range, so not an ideal trade (also big tail below). Most traders sold at the close of the follow-through bar (11:20) but again, not perfect.
Those traders that sold were expecting disappointment and a possible reversal up, which is why you see the big tail on 13:25.
Think about the L1 at 11:35 PT. Here we have a just above support (low of the day) in a likely trading range day. This is a low probability area to short. Let’s assume a trader has at best a 50% chance of breaking below the day’s low at 11:35 (I think the probability is closer to 45%). If you have a 50% probability, you need a good risk/reward. One way I can get that is if I use a tight stop, such as above the 11:35 high. So If I sell at 11:35 (50% chance of success) and exit above 11:35 PT, I am not going to look to buy for at least a few legs up.
The above is why 11:40 formed and closed near its high. It was caused by bears exiting above 11:35, and they will not look for buy again for several bars, making 11:40 a good buy.
I hope this helps.
Brad
Thanks Brad, this was incredibly helpful.
I think I understand H2 on a shorter TF when trying to enter a BO on a 5 min chart. I am assuming, it is to enter a bit earlier and getting better RR ratio, right?
Also, would you kindly confirm if I got the logic of 45% probability right? My understanding is – since it is below the mid-point of the day’s range in what is expected to become a TR/Broad Channel day, it is below 50%. Now, it is not as low as 40% because that would mean the bull case is very strong(60%), which it wasn’t at that point, hence the 45% probability assumption?
Finally, in the penultimate and the last paragraph, you mention they will not look to buy for several bars – is it a typo and you meant they will not look to sell?
Thanks again for your help. I learnt a lot from your answer.
When I said 45% I am implying that the probability is low. Since the market is in a trading range, the probability is not as bad as 40% but probably not 50% so I just picked 45%.
The important part here is that a trader needs to go for 2x their risk, and if selling below 11:45 is going to work, it should not go above the 11:45 bar.
Correct, I meant to say that bears will not look to sell for many bars. Good catch.
I see. Yes, it makes a lot of sense.
Thanks again for your help.