Weekend report co-author Andrew A.
Market Overview: Weekend Market Analysis
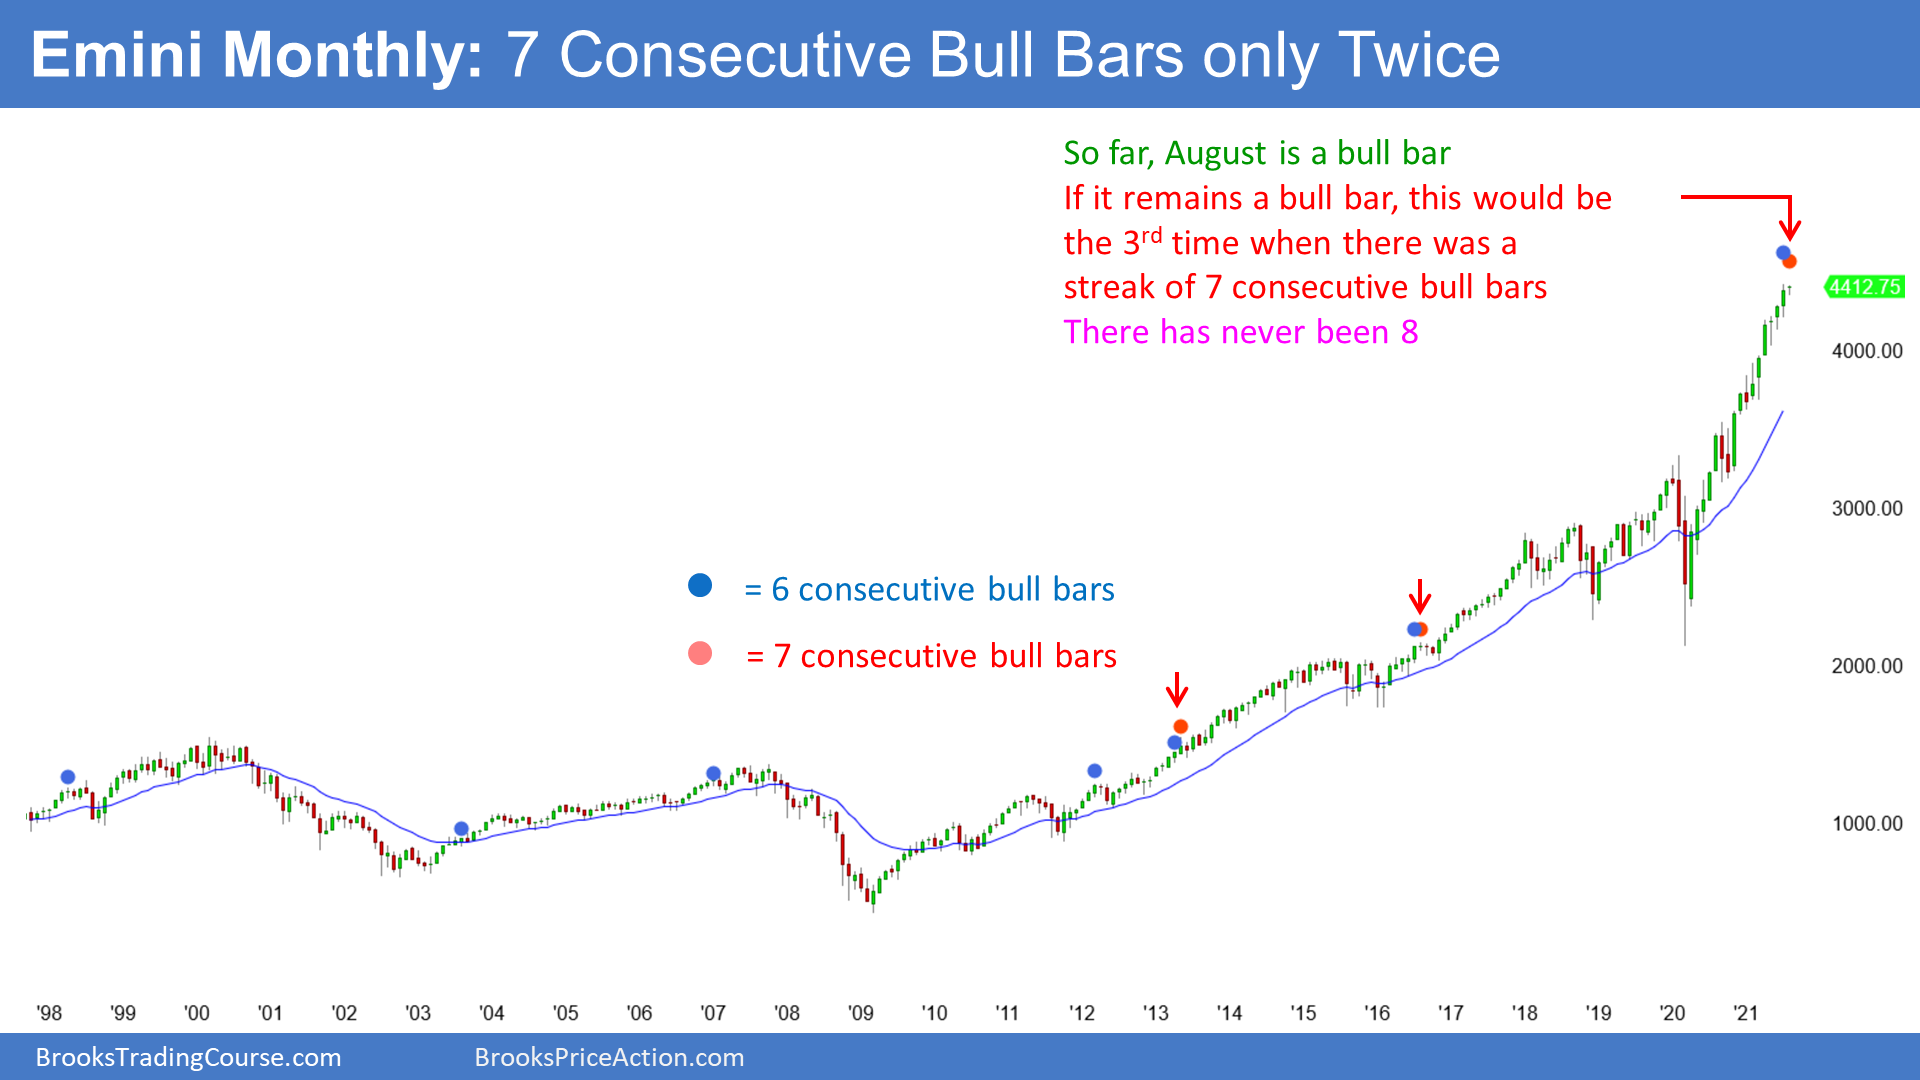
The SP500 Emini futures monthly chart 7 bull bar streak continues to slightly favor sideways to upside, but profit taking activity can begin at any moment. Bulls need follow through buying next week while bears wants a failed breakout from the tight trading range.
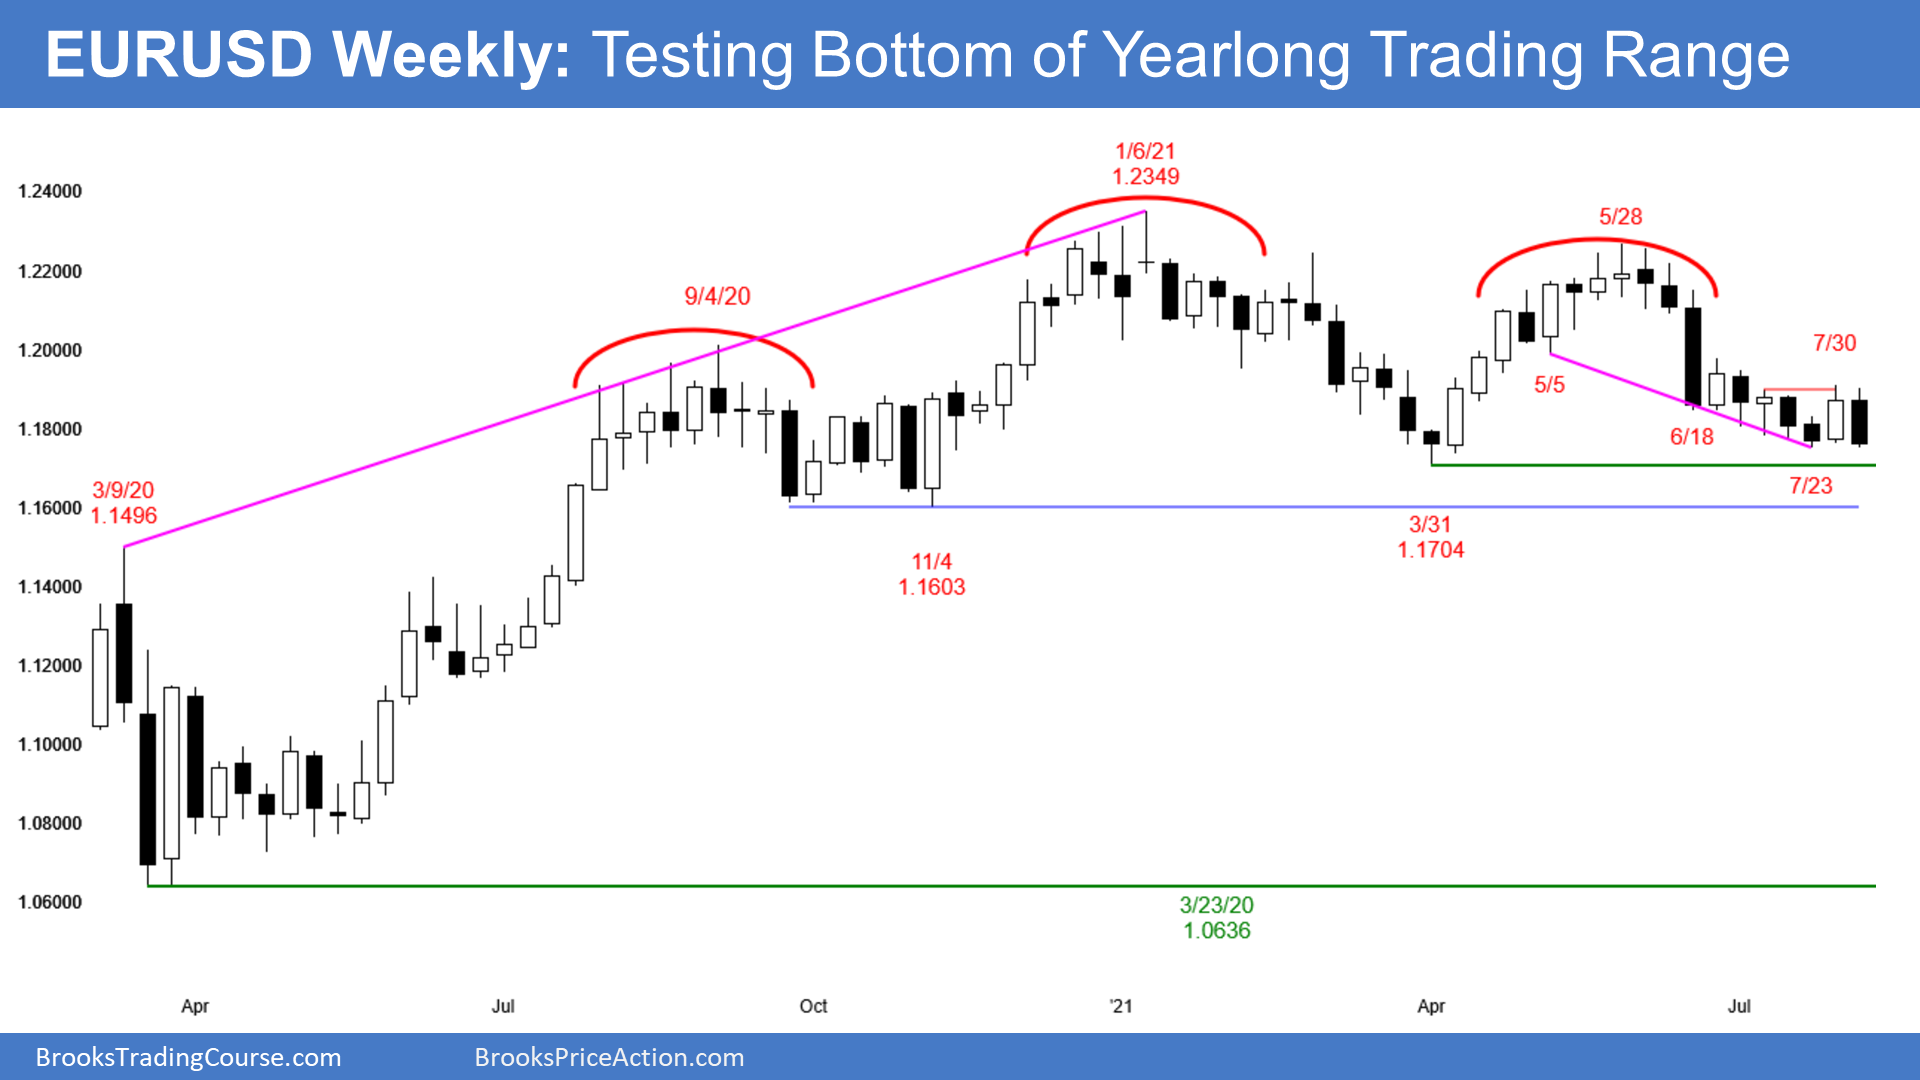
The EURUSD Forex triggered a Low 1 sell signal and closed near the lows. Odds slightly favor sideways to downside to test the lows of the yearlong trading range areas.
EURUSD Forex market
The EURUSD weekly chart

- The EURUSD Forex weekly chart traded below last week’s low triggering a Low 1 sell signal from a Double Top Bear Flag with July 6th high.
- Bulls failed to get follow-through buying after last week’s bull bar. Instead of trading above last week’s high, this week traded below its low. Last week was a small bull trap.
- While last week was a High 1 buy signal, it came in a 9-bar bear micro channel. The reversal up was likely to be minor. Traders had been selling below the high of the prior week for 8 weeks. They were eager to have an opportunity to sell above the high of the prior week.
- The bears want a strong break below the November 2020 low, which is the bottom of the yearlong trading range and the neckline of the head and shoulders top.
- They then want a 700-pip measured move down to last year’s low.
- However, trading ranges resist breaking out. Consequently, if there is a break below the November low, it will probably fail within a few weeks.
- Since this week closed at the lows, EURUSD should trade sideways to down next week as it continues to test the low of the yearlong trading range.
S&P500 Emini futures
The Monthly Emini chart

- So far, August is a small bull bar trading slightly above July’s high.
- In the 25-year history of the Emini, there have been only 2 times when there were 7 consecutive bull bars on the monthly chart. If August remains a bull bar, this would be the 3rd time. There has never been a streak of 8 consecutive bull bars so August or September should be a bear bar.
- If either of them is, the yearlong rally will be a parabolic wedge. That should lead to 2 to 3 months of sideways to down trading.
- But, because the bull trend is so strong, traders will buy the pullback, even if it is 20%.
- The bears have not yet been able to create a bear bar or even a bull bar with a prominent tail on top for 6 months.
- Sometimes in a buy vacuum, sellers stop selling until the price reaches measured moves and targets above.
- The next measured move is 4537 (not shown) based on the height of the pandemic.
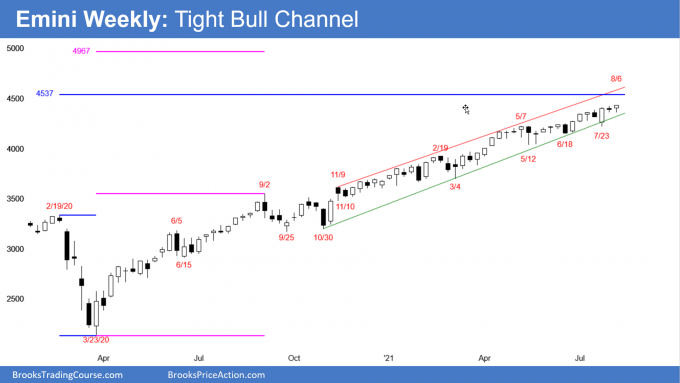
The Weekly S&P500 Emini futures chart

- The Emini weekly bar closed above the top of a 5-week tight trading range. However, the bar was small and therefore the breakout so far is not strong.
- It has been in a Small Pullback Bull Trend for more than 60 bars, which is unusual, and therefore unsustainable and climactic.
- A Small Pullback Bull Trend ends with a big pullback. The biggest pullback so far was the 10% selloff in September. A bigger pullback means 15 to 20%.
- The bears have not been able to create strong bear bars or consecutive bear bars.
- There are also no prominent tails above bars. This means the bulls have been buying into closes, and they do that because they expect the next bar to be higher.
- The move up is in a tight bull channel which is also a sign of strength for the bulls.
- Until the bulls aggressively take profits, the bears will not sell. The bears need to see one or more big bear bars before they will look for a 2-to 3-month correction.
- Until then, traders will continue to bet on higher prices and that every reversal attempt will fail.
- The next targets for the bulls are the 4537 measured move based on the height of the pandemic sell-off and the top of the trend channel line around 4600.
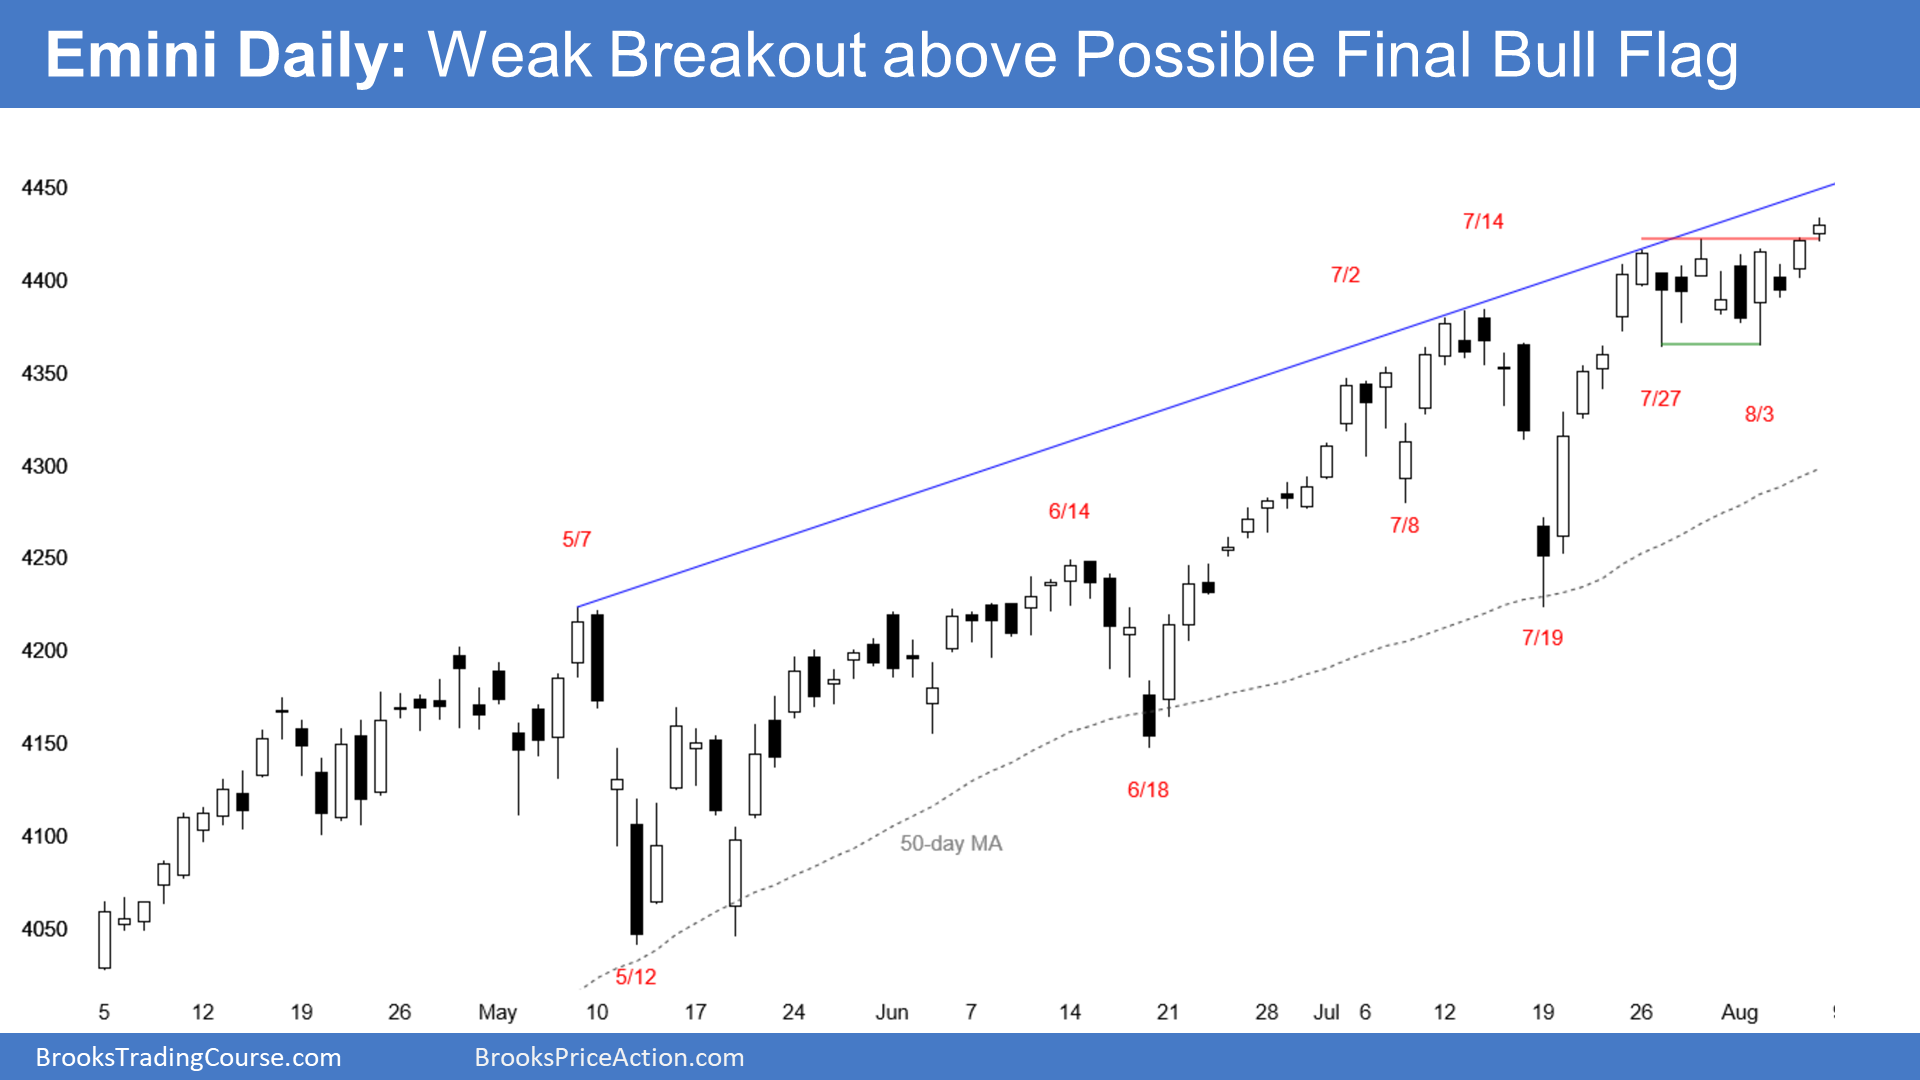
The Daily S&P500 Emini futures chart

- The S&P 500 Emini broke above a tight trading range late in a bull trend so the trading range might be the Final Bull Flag.
- Small breakout to new all-time high and above the 10-day tight trading range.
- The bulls need follow-through buying next week to increase the odds of a 60-point measured move up, based on the height of the trading range.
- If the rally reaches the measured move up around 4500, it will break the trend channel line. A break above a bull channel has a 75% chance of starting to reverse down to the bottom of the channel (bull trend line, not shown) within about 5 bars.
- The bears want the breakout above the 10-day tight trading range to fail. If any breakout is going to fail, it should do so within about 5 bars.
- While the trend has been overextended and extreme, bulls continue to bet on higher prices because they know that in a strong trend, most reversal attempts fail.
- Traders need to see aggressive profit-taking and consecutive strong bear bars before they will be willing to short aggressively.
Trading Room
Traders can see the end of the day bar-by-bar price action report by signing up for free at BrooksPriceAction.com. I talk about the detailed Emini price action real-time throughout the day in the BrooksPriceAction.com trading room. We offer a 2 day free trial.
Weekly Reports Archive
You can access all weekly reports on the Market Analysis page.


Hi Al,
I have 2 doubts:
1.In the monthly emini chart, you’ve written that the parabolic wedge rally should lead to 2-3 months of sideways to down trading.. But normally shouldn’t parabolic wedges lead to approx 10 bars 2 legs? Why just 2-3 bars?
2. In the daily chart, is it a typo that “The bears want the breakout above the 10-day tight trading range”.. If not, then do you mean that bears want a breakout above so that they can sell above the TTR (since it is such a strong trend so they don’t want to sell anywhere but on a new high) to make it a failed breakout?
Thanks
Hi Shubh,
On point 2, yes thanks, the words “…to fail.” had been accidently removed it seems during edits! Now fixed.
On point 1, the initial move down suggested may be part of a developing 2 legged move. Al may review and add some text to say more but trying hard not to write too much! : )
Two initial objectives for a reversal from a buy climax is 2 legs sideways to down and the selloff could last about half as many bars as were present in the buy climax. Here, the parabolic wedge has lasted since the September pullback. That is 12 bars ago. Therefore, one goal might be about a 6-bar selloff.
However, when a bull channel is as strong as this one has been, the 1st reversal from a parabolic wedge is typically minor. That means a bull flag.
Also, the biggest reversal on the monthly chart in over 100 bars has only been 3 bars. Even though last year crashed 35% crash, it was only a 3-bar pullback on the monthly chart.
The bears will probably need at least a micro double top before they can get more than 2 to 3 bars down.
Thanks Dr. Brooks, got quite a few insights from this one..