Market Overview: S&P 500 Emini Futures
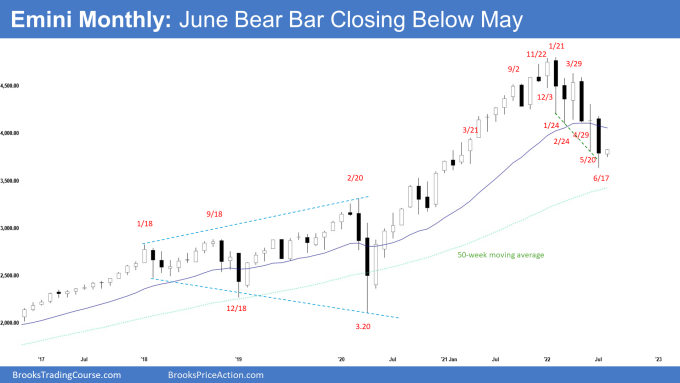
The S&P 500 Emini futures bear bar with long tail below on June monthly chart. It also overshot the trend channel line. Bears want a measured move down to 3600 based on the height of the 9-month trading range height or lower around 3450, based on the height of the 12-month trading range starting from May 2021. The bulls from the January top as a two-legged pullback. They want a reversal higher from a wedge bull flag (February 24, May 20 and June 17) and a trend channel line overshoot.
S&P500 Emini futures
The Monthly Emini chart

- The June monthly Emini candlestick was a big bear bar with long tail below. June closed slightly below May low.
- Last month, we said that odds slightly favor a test above May high and traders will be monitoring whether June closes as a strong bull bar above May, or a surprise bear bar closing near the low.
- June never traded above May high and sold off below May low by the middle of the month.
- The bears see the move down in June as the second leg down from the 1st leg in April. They want a measured move down to 3600 based on the height of the 9-month trading range height, or lower around 3450, based on the height of the 12-month trading range starting from May 2021.
- Since June was a bear bar, it is a sell signal for July. However, the bear bar with long tail below indicates that the bears are not as strong as they could have been.
- Bulls want the breakout below May low to fail and reverse back up. The bull’s case of a failed breakout would have been stronger had June closed above May low and above the middle of the bar around 3910.
- The bulls see the move down from the January top as a two-legged pullback. They want a reversal higher from a wedge bull flag (February 24, May 20 and June 17) and a trend channel line overshoot.
- The Emini closed below the 20-month exponential moving average in June. The last 2 times this happened were during the sell-off in December 2018 and the Covid-19 sell-off in 2020. The Emini then reversed to close above the 20-month exponential moving average the following month.
- Will July be the same? Or will July be a consecutive close below the 20-month exponential moving average?
- While the sell-off since January reached bear market territory (-20% from the high), there are value investors who are looking to buy these deep (-20%, -30%, -40%, -50%) pullbacks.
- The candlesticks down from January to June also had a lot of overlapping bars. That indicates that the bears are not as strong as they could have been.
- While the Emini may continue to trade slightly lower, odds are the Emini should not trade too far below 3400 which is around a -30% correction from the high.
- The trend channel line overshoot in June also increases the odds of a pullback to begin within 1-2 months.
The Weekly S&P 500 Emini chart

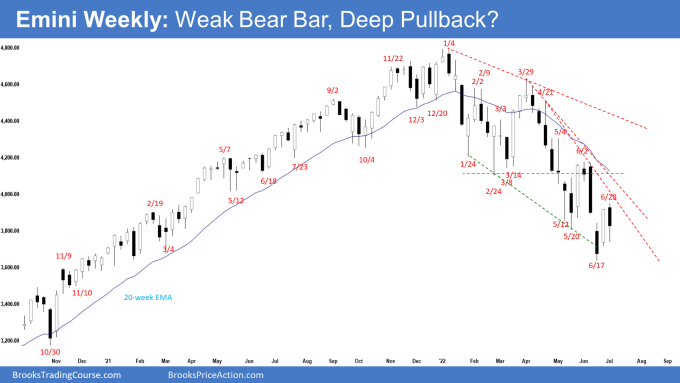
- This week’s Emini candlestick was a bear bar with long tail below.
- Last week, we said that odds favor the Emini to trade at least slightly higher and traders will be monitoring if the bulls get a consecutive bull bar (follow-through buying), something they have failed to do since April.
- This week traded slightly higher, but the bulls failed to get a follow-through bar.
- The bulls hope that this week was simply a deep pullback and wants another leg sideways to up. They want a failed breakout below the May low.
- Bulls see a trend channel line overshoot, and a wedge bottom (Feb 24, May 20 and June 17). There is currently a 3-bar bull micro channel on the chart.
- Bears want a continuation of the measured move down to 3600 or lower around 3450, based on the height of the 12-month trading range starting from May 2021.
- The bears want the Emini to stall around or below the June 2 high, or the bear trend line and reverse lower from a double top bear flag.
- They see the pullback last week as a 50% retracement of the first leg down.
- The bears will need to create a follow-through bear bar next week. If they get that, odds of a re-test of June low and a breakout attempt increase.
- Since this week was a bear bar, it is a sell signal bar for next week. However, the long tail below makes it a weaker sell signal bar.
- Can next week trade higher without trading below this week’s low?
- Yes, it is possible. It would be the second leg sideways to up of the pullback.
- The bulls will need to create consecutive bull bars trading far above the June 2 high to convince traders that a reversal higher may be underway.
- The trend channel line overshoot increases the odds of a 2-legged sideways to up pullback beginning within 1 to 3 weeks. The pullback phase may have started 2 weeks ago.
Trading room
Traders can see the end of the day bar-by-bar price action report by signing up for free at BrooksPriceAction.com. Al talks about the detailed Emini price action real-time throughout the day in the BrooksPriceAction.com trading room. We offer a 2 day free trial.
Market analysis reports archive
You can access all weekend reports on the Market Analysis page.
Andrew hey, thanks for the report. Just to understand the wedge bottom calculation method, why does you start to count it (1st leg) from Feb’ and not from Jan’?
Dear Eli,
A good day to you..
Actually I think either Jan or Feb low is fine..
I use Feb because I see Jan to Feb as a single swing, a 2 legged move which started in Jan, and ended after a pullback and a second leg down in Feb..
As the chart continue to develop, the May + June may end up as a single larger second leg.. (assuming the Emini continue to go down in a broad bear channel pullback)
As Al says, there are many ways to count the legs of a wedge, we just want to know that the market has attempted to push down several times, and may attempt to do the opposite if it does break down after those pushes..
Have a wonderful week ahead Eli! Happy 4th!
Best Regards,
Andrew
Thanks Andrew for clarifying this. Have a great holiday!
On the daily chart I see a two-leg decline from 1/4 to 2/24 and a two-leg correction up to 3/29. From there a spike and channel down with one more new low needed to finish the pattern. We’ll see.
Dear Andrew,
A good day to you.. addressing you is like addressing myself.. 😀
Yeah, I agree.. it is totally possible.. that Jan + feb = Leg 1,
April + June = Leg 2,
If the pullback (correction) continue to be drawn out, then another 2 legged sideways to up bounce like the one leading to 3/29, followed by another drawn out 1-3 months 3rd leg down..
Have a wonderful week ahead Andrew! Happy 4th!
Best Regards,
Andrew