Weekend report co-author Andrew A.
Market Overview: Weekend Market Analysis
The SP500 Emini futures should form a bear candlestick in August on the monthly chart after a rare streak of 6 consecutive bull bars. If so, the Emini will probably correct 15 to 20% into October.
The EURUSD Forex monthly chart formed a small doji bar in July after a big bear bar in June. It is near the bottom of a yearlong trading range. It should bounce in August. On the weekly chart, this week was the 1st pullback in an 9-bar bear micro channel. The 1st reversal up should only last a few bars before there is a test back down.
EURUSD Forex market
The EURUSD monthly chart
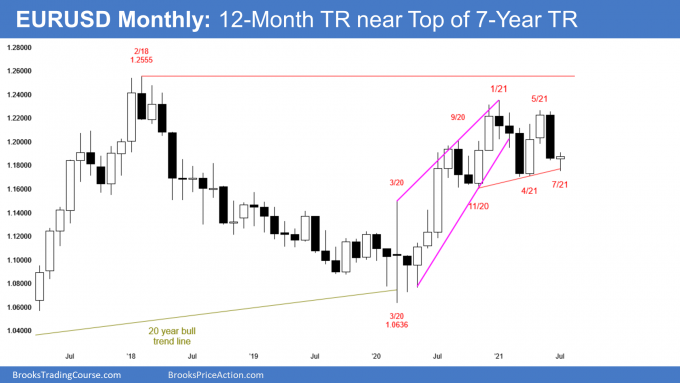
- On the monthly EURUSD Forex chart, July was a small doji bar. It is a weak buy signal bar for a higher low in a bull channel, especially after the big bear bar in June.
- A weak buy setup usually leads to a bounce and not a bull trend. Therefore, August should go above the July high, but the rally will probably not reach the May high.
- After the big bear bar in June, there was no follow-through from the bears.
- Possible end to a 2-legged pullback from January and a bounce from a higher low wedge bull flag.
The EURUSD weekly chart
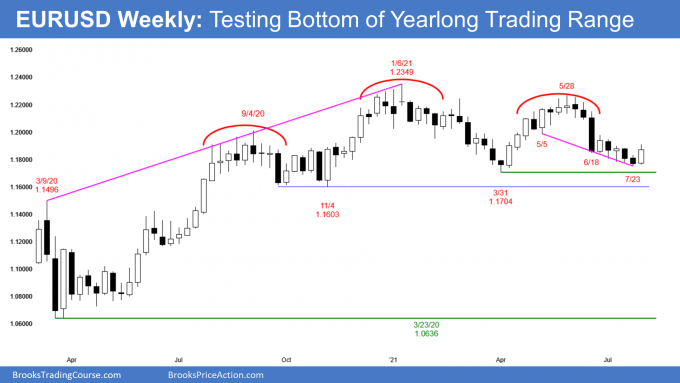
- The EURUSD Forex weekly chart rallied this week. The rally should test the June 25 bull bar within a few weeks.
- However, this week had a prominent tail above.
- Also, the context is bad for the bulls. Last week was a bear bar, which is a weak buy signal bar.
- Additionally, the EURUSD has been in a bear microchannel for 9 weeks. Traders will therefore likely sell within a couple of weeks, expecting a test of last week’s low and possibly the March 2021 low.
- The bears want a strong break below the November 2020 low, which is the bottom of the yearlong trading range and the neckline of the head and shoulders top.
- The selloff is reversing up from just above the neckline of the Head & Shoulders pattern. The bears needed a follow-through bar, but EURUSD reversed higher and became a failed breakout instead.
- A possible wedge bull flag higher low reversal if the bull can get follow-through buying over the next few bars.
S&P500 Emini futures
The Monthly Emini chart
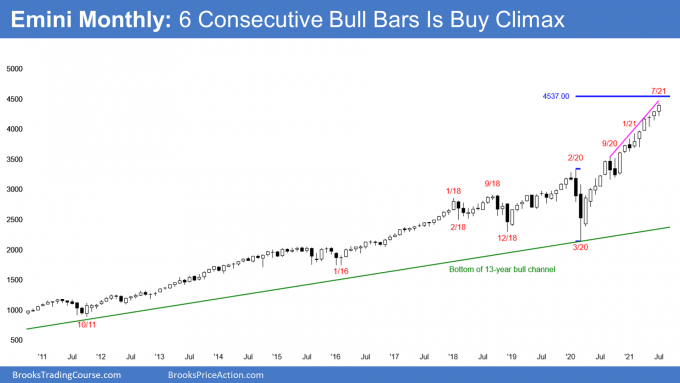
- July was the 6th consecutive bull bar. This has not happened in 10 years. Therefore, a 7th bull bar would be even more unusual. Consequently, August should be a bear bar.
- If it is, the yearlong rally will be a parabolic wedge. That should lead to 2 to 3 months of sideways to down trading.
- But, because the bull trend is so strong, traders will buy the pullback, even if it is 20%.
- The bears have not yet been able to create a bear bar or even a bull bar with a prominent tail on top for 6 months. The bulls are buying aggressively into the close of every month and that increases the chance of at least slightly higher prices.
- Sometimes in a buy vacuum, sellers stop selling until the price reaches measured moves and targets above.
- The next measured move is 4537 based on the height of the pandemic.
- It would also be a trend channel line overshoot which increases the odds that we will see sellers appear.
The Weekly S&P500 Emini futures chart
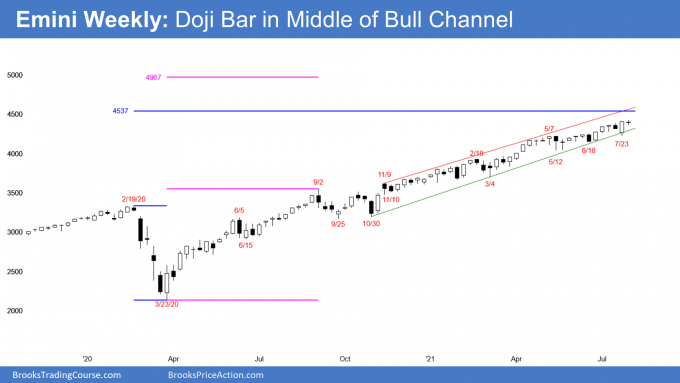
- This week was a bear doji bar. That is a weak sell signal bar, but the weekly chart is extremely overbought.
- The bulls were not able to create a follow-through bar after breaking into new highs from last week’s outside bull bar.
- It has been in a Small Pullback Bull Trend for more than 60 bars, which is unusual, and therefore unsustainable and climactic.
- A Small Pullback Bull Trend ends with a big pullback. The biggest pullback so far was the 10% selloff in September. A bigger pullback means 15 to 20%.
- Traders have bought every reversal for a year. They know the odds are that reversals will fail.
- However, they also know that one should be successful soon.
- When there is a successful trend reversal, there is not a consensus that it will succeed until it is already half over.
- Until there is a strong, clear reversal, traders will continue to bull every 1 – 2 bar (week) selloff.
- A Small Pullback Bull Trend is a sign of very eager bulls. They are buying small pullbacks because they doubt there will be a big pullback.
- Even once there is a big pullback (15 – 20%), they will still buy it, betting that there will be a test of the old high. Consequently, the 1st reversal down will still be minor, even if it is 20%.
- The next targets for the bulls are the trend channel line and the measured move around 4537.
The Daily S&P500 Emini futures chart
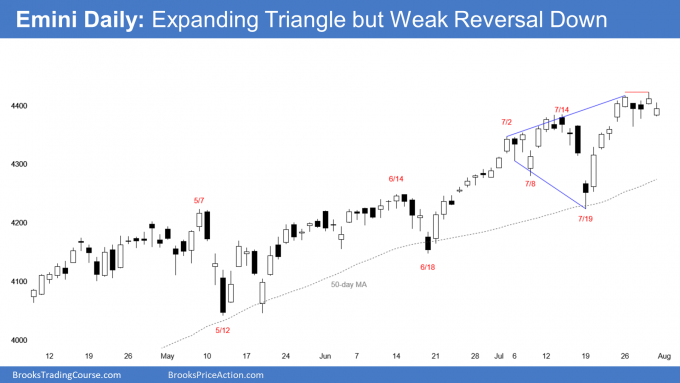
- Friday triggered a micro double top sell signal, but Thursday was a bull bar. This is therefore a low-probability sell signal.
- There is also an expanding top with the July 7 and July 14 highs, and the Emini is near the top of the bull channel, using the May 7 and July 14 highs.
- Until there is a strong reversal down, traders will continue to bet on new highs.
- Bear bars have tails below and small bodies, which means the bears are not selling into the close of bars. They lack conviction and are unwilling to sell low.
- Also, there are no consecutive strong bear bars.
- Until the bulls aggressively take profits and the bears generate sustained, aggressive selling, the bulls remain in control.
Trading Room
Traders can see the end of the day bar-by-bar price action report by signing up for free at BrooksPriceAction.com. I talk about the detailed Emini price action real-time throughout the day in the BrooksPriceAction.com trading room. We offer a 2 day free trial.
Weekly Reports Archive
You can access all weekly reports on the Market Analysis page.
thanks for your post.
Your course as well as you analysis are very informed and practical.
Did you have a mentor or teacher who taught you trading ?
If you learnt all this on your own experience how you demystified what is happening in the market like trend formation, Always in, behaviour of the bulls and bears. Even on bar by bar basis. How long it took for you to identify them?
I learned everything on my own. I’ve talked about it occasionally in the chat room.
Back in the 1980’s, the trading world was filled with con men. I quickly learned that I had to figure it out by myself. One of my goals was to be able to clearly explain what I am doing so that others would be able to learn things much faster than was possible 35 years ago.
thanks for the reply.
Sorry for several questions I asked. I looked at the trade station and the continuous contract with symbol @ES has a high 3338 in February 2020 and low 2125.75 in March 2020. that distance is 1212.25 which I add to 3338 I get to 4550.25 which still is different than your measured 4537. Can you please let me know what is the symbol in tradestation that I should use to get to that 4537
How is measured move ES 4537 calculated? I think you are using Feb 2020 high and March 2020 low, but I don’t understand how you got to 4537. Thanks
You are correct. Take the distance between those 2 prices and add it to the February 2020 high.
Thanks, but the distance from February high (3397.5) to March low (2174) is 1223.5. if we add 1223.5 to 3397.5 then we get to 4621. So I still don’t understand 4537
You are using different data. You might be using the Globex chart or the September contract. I use the continuous contract.
Can you please tell me which platform do you use? I use thinkorswim and I think /ES is a continues contract.