Trading Update: Monday April 11, 2022
Emini pre-open market analysis
Emini daily chart
- Friday closed as a bear doji bar just under 4,500.
- The March 3 breakout point is an obvious magnet below (4,405). It is close enough to 4,400 that the market will likely have to test both price levels soon, so the market may continue down to this area before turning.
- In a trading range, most breakout points (gaps) close, so the odds favor the market closing this gap.
- Right now, the odds favor more sideways for the next couple of trading days
- The bulls will try for the double bottom with March 23 and the High 2 with April 1 and April 6. The bears hope that March 29 leads to an endless pullback and ultimately a downside breakout. The bears do not care if the market continues in a trading range as long as the market continues to form lower highs, with March 29 being the start of the selloff.
- More likely, the market will continue sideways around the 4,500 round number. 4,450 is the midpoint of the trading range from the all-time high to the February lows, and 4,500 is close enough to it, so sideways is most likely.
Emini 5-minute chart and what to expect today
- Emini is down 30 points in the overnight Globex session.
- The market has been in a broad trading range since Sunday’s open. It is at the bottom of the trading range and may try to bottom soon.
- The market is currently testing the April 6 and 7 low (4,444.5). It is close enough to it that it will probably reach it today.
- Traders should expect trading range trading on the open today and be prepared to trade the market with limit orders. Most importantly, if the market is in a trading range, do not be quick to buy at the top or sell at the bottom. If there is going to be a successful breakout that leads to a strong trend, there will be time to enter after it has clearly broken out of the trading range.
- If not comfortable with limit orders, wide stops, and scaling in, consider waiting for a stop entry, such as a double top/bottom or a wedge top/bottom.
- It is essential to be more cautious on the open since there are often opening reversals, it is easy to take a significant loss on the open, and then one is fighting to get back to breakeven the rest of the day. This is why traders should consider not trading for the first 6-12 bars.
Friday’s Emini setups

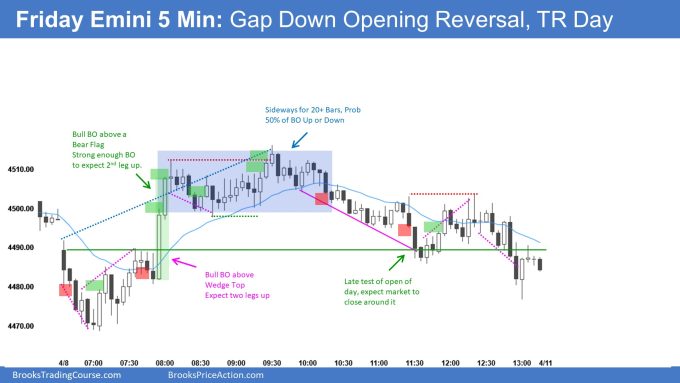
Brad created the SP500 Emini chart.
EURUSD Forex market trading strategies
EURUSD Forex daily chart

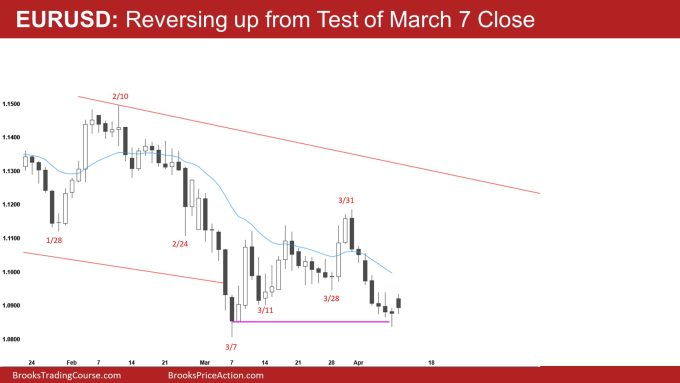
- The EURUSD gapped up on Sunday’s open and is currently testing Friday’s high. Friday tested the March 7 close, an important magnet, and let the theoretical bears out of the market.
- Right now, the bears have seven consecutive bear bars, which increases the odds that today’s close will be a bull bar. Six straight trend bars are rare, let alone 7, so today should have at least a 1-pip bull close.
- While the bears have demonstrated strength by achieving six consecutive bear bars from the selloff starting on March 31, it still looks like a bear leg in what will continue to be a trading range.
- The bulls hope today will lead to an upside breakout of the double bottom, test the March 31 high, and ultimately lead to a measured move of the March April trading range. This measured move would project above the February 2022 high.
- The odds still favor the bulls and the market reaching the top of the bear channel at a minimum. When there is a failed bear breakout at the bottom of the channel, there is at least a 75% chance the market will test the top of the bear channel.
- The bears hope that the wedge top (March 10, March 17, March 31) will lead to a second leg down following any pullback and ultimately break below the March 7 low and lead to a measured move down — which would reach the 2020 low at a minimum.
- Overall, traders should expect the EURUSD to go sideways to up at a minimum over the next couple of days. Also, the market is in a trading range, so traders should expect the bears to become disappointed soon. One way to disappoint the bears would be a deep pullback that tests back to the midpoint of the March – April trading range.
Summary of today’s S&P Emini futures price action and what to expect tomorrow

Al created the SP500 Emini chart.
End of day summary
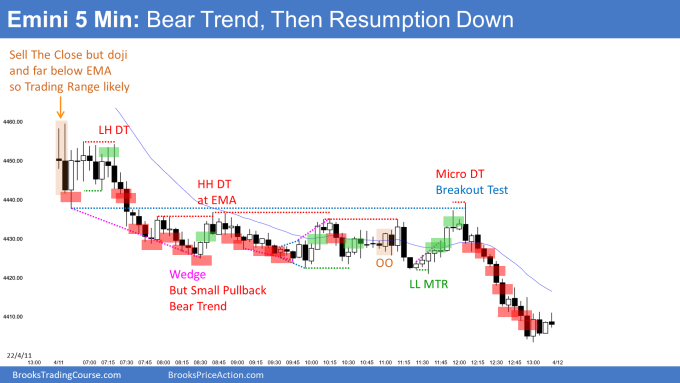
- The Emini had a big gap on the open for the first 10 bars.
- The market got close to the moving average around the final hour and sold off in the form of 7 consecutive bear bars. While the market was Always In short, the odds favored a test of the moving average, which is why the market went sideways to up around 8:00 PT.
- The market was always in short and in a bear trend, but the price action was not exceptionally strong.
- Think about it, the moving average is a reflection of “average price,” so why sell far below the moving average if the price action is not exceptionally strong. (Al Talks a lot about this in the trading room).
- Next, the market went sideways for 20+ bars making the market in breakout mode and probabilities close to 50%.
- The bears tested the breakout point of bar 3 around 12:00 PT and got trend resumption into the close.
- Overall, today was a good reminder that most major trend reversals are minor and lead to more sideways (LL MTR at 11:35 PT). Also, the market usually goes sideways for the first 6-12 bars on the open, so traders should be more cautious and expect a limit order market.
- The bears were able to get a strong bear close on the daily chart, closing the March 3 breakout point gap.
- Today was a strong reminder that the market is in a trading range. The bears will try and get follow-through tomorrow, which would increase the odds for lower prices on the daily chart.
See the weekly update for a discussion of the price action on the weekly chart and for what to expect going into next week.
Trading Room
Traders can see the end of the day bar-by-bar price action report by signing up for free at BrooksPriceAction.com. Al talks about the detailed S&P Emini futures price action real-time throughout the day in the BrooksPriceAction.com on trading room days. We offer a 2 day free trial.
Charts use Pacific Time
When times are mentioned, it is USA Pacific Time. The Emini day session charts begin at 6:30 am PT and end at 1:15 pm PT which is 15 minutes after the NYSE closes. You can read background information on the market reports on the Market Update page.
Given the March 3rd gap on the daily chart is closed, wondering if the forecasted MM from the bottom of the range through March 3rd is still intact for the bulls?
it is possible, but most traders will ignore it due to today closing below the breakout point. Most traders will look for other support and resistance levels.
There are still breakout points below such as the March 9 and March 11, and it is possible the market may have to get down there.