Trading Update: Tuesday July 18, 2023
S&P Emini pre-open market analysis
Emini daily chart
- The daily chart has had six consecutive days without falling below the prior bar, indicating bullish strength. However, this also makes the market climactic and increases the odds that the Emini will fall below yesterday’s low (4,536.25).
- Traders should expect the next day or two to lead to sideways trading and disappoint the bulls.
- The channel up from the July 10th low is tight, which increases the odds that the first reversal down will be limited.
- The first target for the bears is 4,500; however, for them to reach it, they will likely need to develop more selling pressure first.
- Traders expect a pullback soon and will closely monitor the strength of the pullback. If the bears can get consecutive strong bear closes, that will increase the odds of a second leg down and lower prices.
- Overall, the market is Always In Long, which means the odds favor higher prices and a second leg up. However, as mentioned above, traders will pay close attention to any pullback to measure the strength of the bears and the determination of the bulls to buy and pullback.
Emini 5-minute chart and what to expect today
- Emini is down 4 points in the overnight Globex session.
- The 60-minute Globex chart sold off, forming a second leg down after yesterday’s late end-of-day selloff at the close of the U.S. Session.
- The market is in the middle of a trading range that has gone on for a day or two.
- Traders should be neutral going into the day and assume that the odds favor a trading range open.
- This means traders should expect a limit order market to last for the first 6-12 bars at a minimum. Most traders should consider not trading unless they are comfortable using wide stops and scaling in.
- There is at least an 80% chance that the open will form the opening swing after forming a double top/bottom or a wedge top/bottom. This means a trader can wait for one of the patterns mentioned above to form and enter a stop taking a chance of catching the opening swing and getting more than twice their risk.
- Lastly, traders should pay close attention to yesterday’s low as it will likely be an important magnet today.
Yesterday’s Emini setups

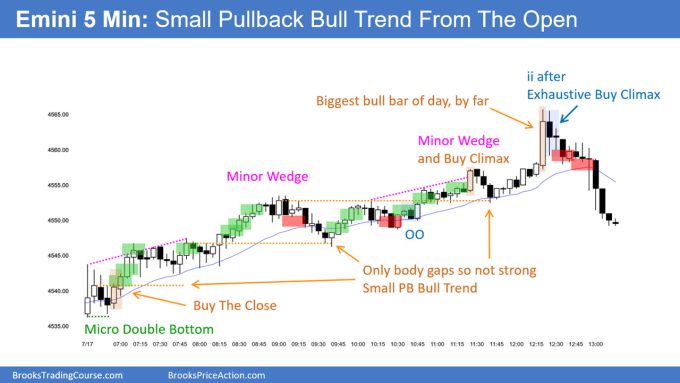
Al created the SP500 Emini chart.
Here are several reasonable stop entry setups from yesterday. I show each buy entry with a green rectangle and each sell entry with a red rectangle. Buyers of both the Brooks Trading Course and Encyclopedia of Chart Patterns have access to a near 4-year library of more detailed explanations of swing trade setups (see Online Course/BTC Daily Setups). Encyclopedia members get current daily charts added to Encyclopedia.
My goal with these charts is to present an Always In perspective. If a trader was trying to be Always In or nearly Always In a position all day, and he was not currently in the market, these entries would be logical times for him to enter. These therefore are swing entries.
It is important to understand that most swing setups do not lead to swing trades. As soon as traders are disappointed, many exit. Those who exit prefer to get out with a small profit (scalp), but often have to exit with a small loss.
If the risk is too big for your account, you should wait for trades with less risk or trade an alternative market like the Micro Emini.
EURUSD Forex market trading strategies
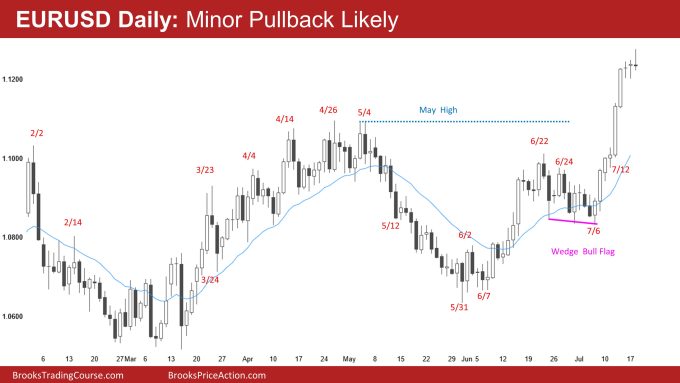
EURUSD Forex daily chart

- The EURUSD had a strong rally last week. However, it is becoming climactic, which increases the odds of a pullback lasting a few days.
- The risk is getting big for the bulls, so institutions must manage their risk properly. This means they will likely need to reduce risk by taking partial profits. This will increase the odds of a brief pullback.
The bears know this and will look to sell, betting on a brief pullback. However, they know some bulls will look to buy any pullback betting on higher prices. - Overall, the odds favor higher prices. However, the market may have to pull back first before the bulls can get a second leg up following last week’s strong bull bars.
Summary of today’s S&P Emini price action

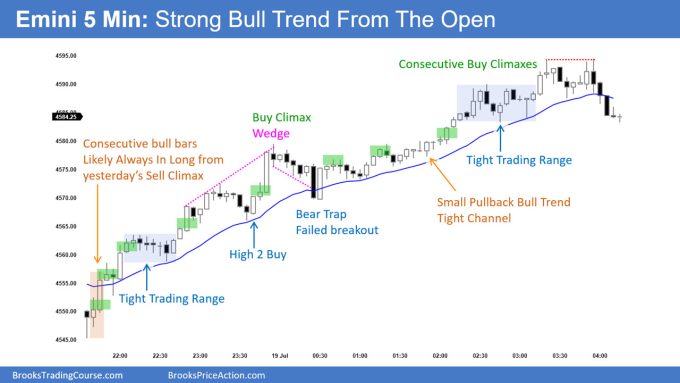
Richard created the SP500 Emini chart (Al travelling).
End of day video review
Today’s End Of Day review will be presented in the Trading Room and only available to the trading room subscribers.
See the weekly update for a discussion of the price action on the weekly chart and for what to expect going into next week.
Trading Room
Al Brooks and other presenters talk about the detailed Emini price action real-time each day in the BrooksPriceAction.com trading room days. We offer a 2 day free trial.
Charts use Pacific Time
When times are mentioned, it is USA Pacific Time. The Emini day session charts begin at 6:30 am PT and end at 1:15 pm PT which is 15 minutes after the NYSE closes. You can read background information on the market reports on the Market Update page.
Hi, why is Bar 2 a buy? Doji, isn’t it a trading Range at this point?
Hi Hardy.
You are right to challenge this buy. Problem is I trade the ETH, and a tick chart, where a trade setup was clear to me at this point from (1) overnight buying pressure before open and (2) the previous day’s sell climax as noted.
So for a 5-min RTH trader this can be seen as risky for the reasons you state (doji/TR) although reasonable given the previous sell climax and tight stop.
Al will be back tomorrow. I will be more careful in future. I really should put up my tick chart rather than retrofitting setups to the 5-minute chart. 🙂
Thanks Richard, good points. I kept waiting for a second leg down after yesterday’s climax. After a series of buy climaxes (with gaps), and still in the dayslong Trading Range a reversal looked imminent. I exited my extended longs way too early (around 4560) and got “obsessed” with the reversal that never happened, erasing most from my handsome profits. What a waste…. 🙁
Thank you Richard for your answer. My intention was not to challenge this buy. I “felt” the buy above 2 but did not find enough of a setup to execute it. So I was curious about your reason.
Hi Richard, if it is not too much to ask – would it be possible for you, in addition to your already heavy workload to occassionally post your findings here or in the support forum?
Your ‘tick chart’ and ‘buying pressure’ comment got me incredibly curious and I would be glad to learn from someone as experienced as you(despite you keeping the low profile )
Hi Abir.
I keep promising to do some live trade videos here to follow up on my aging “Order flow support for price action trading” video you can search for/watch on this site.
That video shows my tick chart and setup which is different to the 5-min RTH chart I need to mark up here when Al takes time off.
I am recruiting some help to give me more time for getting to those promised videos, so fingers crossed.
Thanks Richard! I hope you find the requisite time after recruiting the help to follow through on your promise. In the meantime, I will try to brush up on the video you posted and also the resources in the link you shared on that post.
Now that I’m finally getting the hang of PA – a little diversification of my studies can be fun, at least for a little while if I can’t wrap my head around it!
Brad can you point to any of the training videos that specifically talk about minor wedges?
Start with 24 A-E.