Market Overview: S&P 500 Emini Futures
The S&P 500 Emini futures traded higher but gave back most of the gains by Friday. Bears see this simply as an Emini breakout pullback and want another breakout attempt below the June low. Because of the strong selloff, the bulls will need a strong reversal bar or at least a micro double bottom before they would be willing to buy aggressively.
S&P500 Emini futures
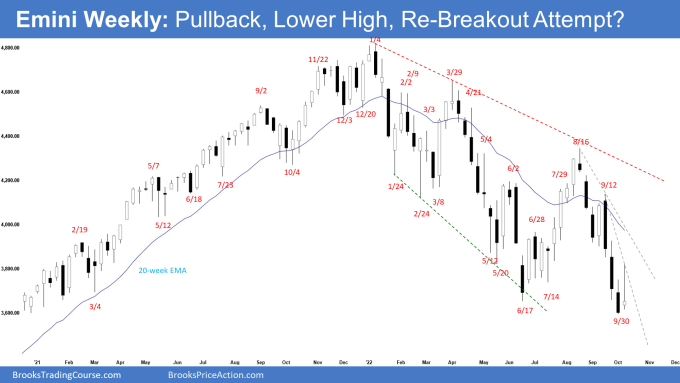
The Weekly S&P 500 Emini chart

- This week’s Emini candlestick was a bull doji with a long tail above, closing in the lower half of the week’s range.
- Last week, we said that odds slightly favor sideways to down and traders will be monitoring whether the bears get a follow-through bear bar following the breakout below the June low.
- The bears did not get follow-through selling below the June low. While the Emini traded higher, it was a weak bull bar.
- They want a strong leg down like the one in April and a retest of the June low. They got what they wanted.
- The selloff from August is in a tight bear channel. That means strong bears.
- They see this week simply as a breakout pullback and want another breakout attempt below the June low.
- They then want a measured move down to around 3450 based on the height of the 12-month trading range starting from May 2021 or the big round number 3400.
- If the Emini trades higher, the bears want a reversal lower from a lower high around the bear trend line or the 20-week exponential moving average.
- The bulls want a reversal higher from a double bottom major trend reversal with the June low.
- They will need to create consecutive bull bars closing near their highs to convince traders that a reversal may be underway and prevent a strong breakout below the June low.
- Because of the strong selloff, the bulls will need a strong reversal bar or at least a micro double bottom before they would be willing to buy aggressively.
- The problem with the bull’s case was that the recent selloff was very strong. The sideways to up leg may only lead to a lower high. This remains true.
- Since this week was a weak bull doji, with a long tail above, it is not a strong buy signal bar for next week.
- For now, the odds slightly favor sideways to down. Traders will see if the bears get another breakout attempt below June low, or if next week closes with a bull body instead.
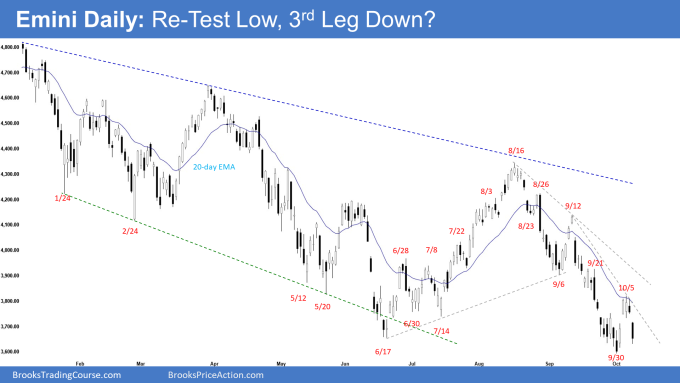
The Daily S&P 500 Emini chart

- The Emini gapped up and closed as a bull bar on Monday. Tuesday gapped up again and traded sideways until Thursday below the 20-day exponential moving average. Friday gapped down creating a small island reversal.
- Previously, we said that while the selloff was strong enough for traders to expect at least slightly lower prices, traders should be prepared for some sideways to up pullback lasting days in between, which can begin at any moment.
- The bulls see the strong selloff simply as a sell vacuum testing June low within a trading range.
- They want a reversal higher from a double bottom with the June low and a wedge bull flag (Aug 23, Sept 6 and Sept 30).
- The bulls will need to create consecutive bull bars closing near their highs soon to prevent a breakout and follow-through selling below the June low.
- The problem with the bull’s case is that the selloff from August 16 was very strong. Sideways to up pullbacks may only lead to a lower high.
- Bulls hope to get a reversal higher from a micro double bottom with Sept 30 low next week.
- We said that if the Emini trades higher, the bears want a reversal lower from a double top bear flag with Sept 21 high, or around the bear trend line or the 20-day exponential moving average. This week reversed lower from the 20-day exponential moving average.
- The bears want a retest of the Sept low, followed by a breakout and a measured move down to 3450 or slightly lower around the 3400 big round number which is also 2020 high.
- Bears want at least another leg down forming the wedge pattern with the first two legs being September 6 and September 30.
- The September low is close enough and likely to be retested again.
- Since Friday was a bear bar with a small tail below, it is a sell signal bar for Monday.
- If the bears get a strong breakout below the September low with follow-through selling early next week, the odds of them reaching the targets below increase.
- For now, the odds slightly favor sideways to down.
Trading room
Traders can see the end of the day bar-by-bar price action report by signing up for free at BrooksPriceAction.com. Al talks about the detailed Emini price action real-time throughout the day in the BrooksPriceAction.com trading room. We offer a 2 day free trial.
Market analysis reports archive
You can access all weekend reports on the Market Analysis page.
Thanks again for your excellent analyses Andrew!
A more technical question, and possibly discussed elsewhere on this website: which instrument / market data do you (and possibly your colleagues) utilize for your daily/weekly/monthly chart reports? Every chart seems to show subtle, yet salient differences from mine. SPX or ES1 RTH on Tradingview, for example, gives again different perspective from my Ninjatrader’s market data (ES 12 – 22, on either CBOE or CME RTH data hours). None of them congruous with yours. Thanks for a reply in advance.
All best and have great evening!
This is a well-known issue with futures data. Many brokers will filter their data to avoid latency or bandwidth issues. This sometimes causes the bars created by different brokers to have slight differences in their OHLC. An unfiltered data feed will have every tick but can become slow in a very fast market and be behind real time in displaying prices. This is besides the issue of RTH vs. extended hour charts which will be different.
Thanks Andrew, appreciated!
Dear Andrew, thanks for your answers..
Dear Sybren, thanks for your comments..
For the Emini, I’m using the ticker @es.d on tradestastion..
I think Al spoke about this before in the past.. need to dig it up in the comments section..
Have a great week ahead!
Best Regards,
AA
A reasonable case can be made that the Emini is forming a large wedge bull flag from the January top. If true then the first two legs both have double bottoms and therefore it would be a good bet that this third leg will also end with a double bottom.
Dear Andrew,
A good day to you.
Yeah, we have talked on this way back in May-June if memory serves on the possibility of this happening..
That’s the larger wedge pattern that I have been referring to in the report.. but the current leg down from Aug is also forming a smaller wedge, an embedded wedge within a larger wedge pattern..
Wishing a great week ahead to you.. be well!
Best Regards,
AA