Market Overview: S&P 500 Emini Futures
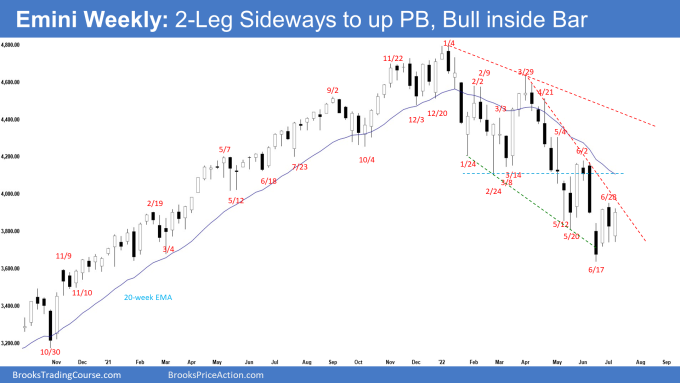
The S&P 500 Emini futures weekly candlestick was an Emini bull inside bar closing near the high. Bears failed to create follow-through selling this week. Bulls want a consecutive bull bar next week, something they have failed to do since April. They want a reversal higher from a trend channel line overshoot and a wedge bottom (Feb 24, May 20 and June 17). Since this week was an inside bar, the Emini is in breakout mode. The bear trend line remains a resistance above.
S&P500 Emini futures
The Weekly S&P 500 Emini chart

- This week’s Emini candlestick was an Emini bull inside bar closing near the high.
- We said last week was a weak sell signal bar and this week could trade higher without trading below last week’s low as it would be the second leg sideways to up of the pullback.
- This week, the bears failed to create a consecutive bear bar.
- Bulls see a trend channel line overshoot, and a wedge bottom (Feb 24, May 20 and June 17). There is now a 4-bar bull micro channel on the chart.
- The bulls will need to create a consecutive bull bar next week to increase the odds of a test of the 20-week exponential moving average or the June 2 high.
- The bears want the Emini to stall at the bear trend line or the 20-week exponential moving average, or around or below the June 2 high and reverse lower from a double top bear flag.
- They want a breakout below the June low and a continuation of the measured move down to 3600 or lower around 3450, based on the height of the 12-month trading range starting from May 2021.
- Since this week’s candlestick was an inside bar, the Emini is in breakout mode.
- Because this week was a bull bar closing near the high, it is a buy signal bar for next week. Next week may even gap up at the open. Small gaps usually close early.
- If the bulls get a consecutive bull bar, something they have failed to do since April, the odds of a re-test of June 2 high increases.
- Can next week trade below this week’s low? While that is possible, the prominent tail below the last 2 candlesticks increases the odds that there will be buyers below.
- We have said that the trend channel line overshoot increases the odds of a 2-legged sideways to up pullback. The Emini is currently in the pullback phase.
- For now, due to the wedge bottom (Feb 24, May 20 and June 17) and trend channel line overshoot, odds slightly favor sideways to up and a test near the June 2 high.
The Daily S&P 500 Emini chart

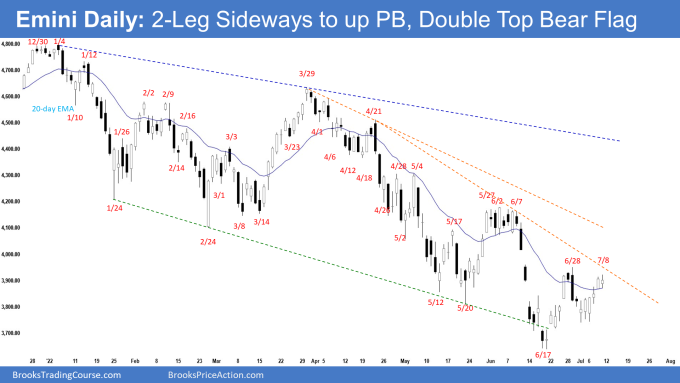
- The Emini traded higher for the whole week following the US Independence Day holiday.
- Previously, we said should the Emini trade higher, but stall around the 20-day exponential moving average, the bear trend line or below the June 2 high, odds are the bears will return to sell the double top bear flag for a retest of the low.
- The Emini is currently stalling around the 20-day exponential moving average and just below the bear trend line.
- The bears want a reversal lower from a double top bear flag (June 28 and July 8) just below the bear trend line.
- Bears want a break below the June low and a continuation of the measured move down to around 3600 based on the height of the 9-month trading range or lower, around 3450 based on the height of the 12-month trading range starting with May 2021.
- The bulls want a failed breakout below the May low.
- They want a reversal higher from a trend channel line overshoot and a wedge bottom (Feb 24, May 20 and June 17).
- They see this week as a second leg sideways to up from a higher low major trend reversal.
- The bear trend line remains a resistance above. The bulls will need to break above the bear trend line with consecutive bull bars closing near their highs.
- For now, because of the trend channel line overshoot and the wedge bottom (Feb 24, May 20 and June 17), odds slightly favor at least slightly higher prices.
- Traders will monitor whether the bulls can create consecutive bull bars breaking far above the bear trend and test the June 2 high for next week.
- If the Emini trades slightly higher but continues to stall around the 20-day exponential moving average or the bear trend line, odds are the bears will return to sell the lower high for a retest of June low.
Trading room
Traders can see the end of the day bar-by-bar price action report by signing up for free at BrooksPriceAction.com. Al talks about the detailed Emini price action real-time throughout the day in the BrooksPriceAction.com trading room. We offer a 2 day free trial.
Market analysis reports archive
You can access all weekend reports on the Market Analysis page.
In the Market Overview section, should the weekly reference “…consecutive bull bar…since April” be since March? I don’t see consecutive weekly bull bars in April. Thank you very much if you have to time to clarify or confirm.
Dear FH,
The last time they had was since March, you’re right. April would be the appropriate month to use. Thanks for pointing it out.
Have a blessed week ahead!
Best Regards,
Andrew
Thanks Brad for the report! How likely on the weekly chart the low of last week is a MDB or DB with the low of June 17th wherbuy the high of the week prior last one is the neckline? Such MM if works will take us to the June high to the tick?
Andrew of course
Dear Eli,
A good day to you.
Yes, such a MM is possible, but I would still want to see how deep is the pullback (if there is any) and whether the Emini stalls at the bear trend line or the 20ema and reverse lower again.
This week is a crucial week. The bulls have failed ro break through these resistances for in recent months, and I would like to see if the same occurs or, if they finally gather enough strength to break above.
Let’s see how the market plays out this week.
Have a blessed week ahead.
Best regards,
Andrew