Market Overview: Weekend Market Update
The Emini has been sideways for 4 weeks. It might have begun its 2nd leg down from its 4 month buy climax. There is a 40% chance of a head and shoulders top measured move down to 2650.
Crude oil had a surprisingly big bear breakout this week. The odds favor at least a small 2nd leg down.
The EURUSD Forex market reversed up from a new low in a yearlong bear channel. Traders expect a rally for at least a couple weeks.
Crude oil Futures market:
Strong bear breakout
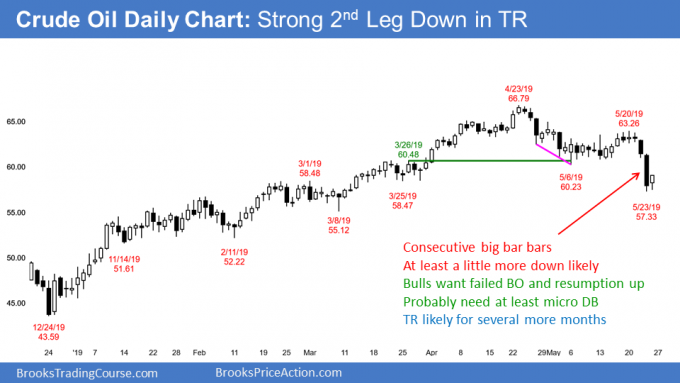
The crude oil futures market sold off sharply this week. I said that there would be at least one more leg down after the selloff to the May 6 low. This week met that goal.
In addition, I said that the selloff might continue down to the start of the 3 month bull channel. That channel began with the January 14 pullback. Its low is 51.61.
Finally, I have been saying that the selloff would be a bear leg in a trading range that would probably last many months. That is still likely.
Trading range for several months
When traders think that a market has entered a trading range, they prefer to sell rallies and buy selloffs. Will they buy this week’s selloff? Thursday was a surprisingly big bear bar. A Bear Surprise Bar typically has at least a small 2nd leg down. Therefore, even if there is a rally for a few days next week, the odds favor at least a small 2nd leg down.
Trading ranges tend to reward limit order traders. They are traders who buy low, sell high, and scalp. They bet against trends.
In a trading range, breakouts usually pull back to test breakout points. Therefore, the bulls who bought the May 6 low of 60.23 will probably be able to avoid a loss if they scale in lower.
Traders expect a test of that low over the next couple weeks. This is especially true because it is also just above the 60 Big Round Number.
However, whether or not crude oil tests $60 next week, the odds favor at least a small 2nd leg down after this week’s bear breakout. It might lead to a measured move down to the January 14 low.
EURUSD weekly Forex chart:
Reversal up from new 52 week low
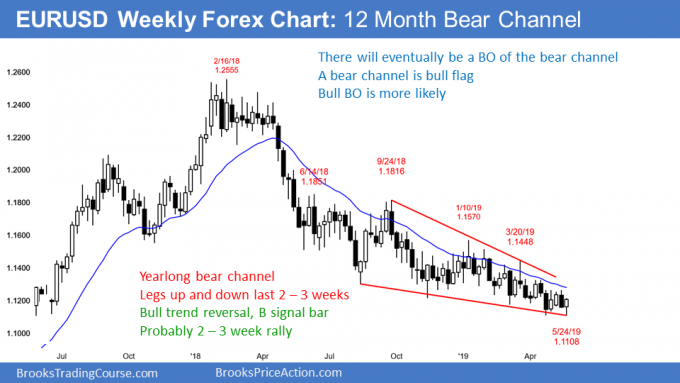
The EURUSD weekly Forex chart this week formed a bull reversal bar. It is therefore a buy signal bar for next week. The odds are that the EURUSD rally will continue for 2 – 3 weeks.
The EURUSD daily Forex chart broke below the April 26 low and reversed up sharply on Thursday. Although that was a new 52 week low, every breakout to a new low over the past year reversed up. That is what happens in bear channels. The Bulls buy below prior lows and bears sell rallies. Both take quick profits.
All legs up and down over the past year have lasted 2 – 3 weeks. The bulls are hoping that this is the start of a 2 – 3 week rally. Thursday was a big outside up day that closed on its high. In addition, it closed above Wednesday’s high. Also, Friday was a bull bar and therefore indicates that the bulls were continuing to buy. This is probably the start of a leg up.
The bears theoretically will exit above the May 1/May 13 double top at 1.1265. Since channels and trading ranges typically disappoint trend traders, if a rally has begun, it will probably go above that double top.
Bear channel is a bull flag
When will the bear trend end? A bear trend needs lower highs and lows. As long as it continues to form major lower highs, it is still intact.
The most recent major lower high is the March 20 high of 1.1448. If the rally breaks above that high, traders will conclude that the bear trend is over.
When a bear trend end, a trading range usually begins. Less often, the rally will continue far up and form a bull trend.
Traders should think of a bear channel as a bull flag. This is because there is a 75% chance of a break above the bear channel.
The bears only have a 25% chance of a successful break below the yearlong bear channel and an acceleration down. If there is a strong break below, it will probably reverse up within a few bars and begin a swing up.
Monthly S&P500 Emini futures chart:
Pullback from test of top of trading range
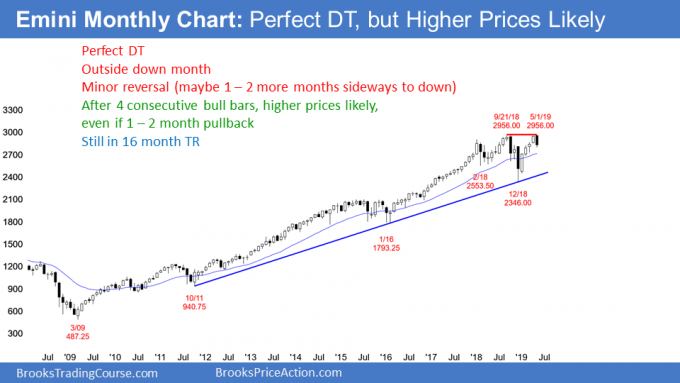
The monthly S&P500 Emini futures chart has been in a trading range for 16 months. It so far has a big bear bar in May. Also, there is a double top with the September high. By trading below last month’s low, May triggered the sell signal for the double top.
But, after 4 consecutive bull bars, this is a low probability short. Consequently, the reversal down will probably be minor. Traders will expect a 1 – 3 month pullback and then another test of the all-time high.
The bears want the selloff to continue to below the December low. That is the neck line of the double top. They then want a 600 point measured move down. There is always a bear case, but this currently has only a 20% probability.
Weekly S&P500 Emini futures chart:
Inside bar so pause in pullback
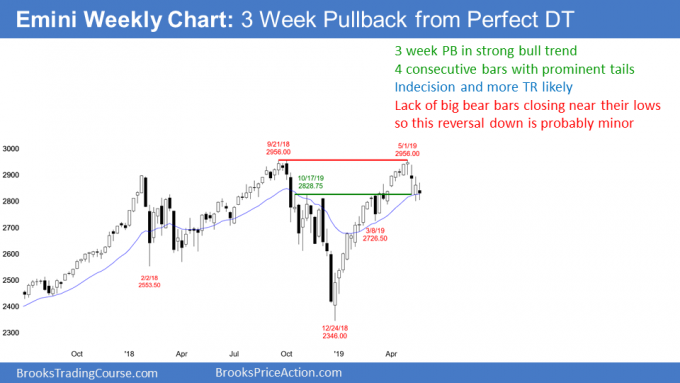
The weekly S&P500 Emini futures chart formed an inside bar this week. Its low was above last week’s low and its high was below last week’s high. Furthermore, the close was around the middle and there were prominent tails above and below.
This is similar to each of the past 3 weeks. It represents a lack of conviction and it is trading range price action. Markets have inertia and tend to continue what they’ve been doing. There is no sign that the trading range trading is about to end. Therefore, it will probably continue for at least a couple more weeks.
The bulls hope that the past 4 weeks are simply forming a pullback to the 20 week EMA. They see this week as a buy signal bar. However, the week had a bear body. Also, there is now a 4 week bear micro channel. This is a weak buy setup. Traders expect that there will be more sellers than buyers above this week’s high.
For the bears, they have a 4 week selloff from a big double top. However, they have been unable to create consecutive big bear bars closing on their lows. In fact, they have been unable to form even a single big bear bar closing on its low. This is not how bear trend reversals typically begin. Consequently, the 4 week selloff is probably a minor reversal.
Daily S&P500 Emini futures chart:
Emini head and shoulders top target is 2650
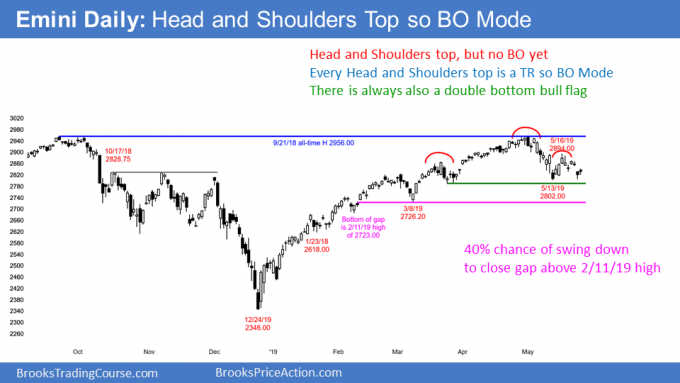
The daily S&P500 Emini futures chart broke below a 2 week triangle on Thursday. Friday was a bear trend bar and it therefore represents follow-through selling.
The bears see the 4 month rally as a buy climax and a test of the all-time high. The May reversal down was strong enough to make a 2nd leg down likely. Traders are beginning to think that the 2nd leg down might have begun with the May 16 high. That is the right shoulder of a head and shoulders top. There is therefore a 40% chance of a 150 point measured move down to 2650.
However, Thursday’s low held above the May 13 low. Consequently, the bulls are hoping that they will get a reversal up next week. This would be a double bottom.
Trading range means lack of conviction
The daily chart has been in a trading range for several weeks. They are a sign of neutrality and balance. There is a lack of conviction. Traders see the price as just about right.
Trading ranges always have both credible buy and sell setups. There is currently both a double bottom and a double top. This is a breakout mode pattern. While the past 2 days have been good for the bears, they need a strong break below the May 13 low before traders will conclude that the 2nd leg down has begun.
2nd leg down likely
Even though the trading range is neutral, the odds continue to favor a 2nd leg down. This is true even if there is a break above the May 10/May 16 double top 1st.
There is a gap above the February 11 high of 2723.00. That is also around a 50% retracement of the 4 month rally. It would also be about a 10% pullback. It is therefore a reasonable magnet below.
What happens if the Emini reaches it? It will probably attract profit taking by the bears. Also, the bulls will look for a reversal up to buy.
Trading Room
Traders can see the end of the day bar-by-bar price action report by signing up for free at BrooksPriceAction.com. I talk about the detailed Emini price action real-time throughout the day in the BrooksPriceAction.com trading room. We offer a 2 day free trial.
Charts use Pacific Standard Time
When I mention time, it is USA Pacific Standard Time (the Emini day session opens at 6:30 am PST, and closes at 1:15 pm PST). You can read background information on the intraday market reports on the Intraday Market Update page.
These updates are very helpful. Thank you very much. I have especially appreciated them since for several days now it has been difficult to decide whether to take a bullish or bearish position. Thanks again.
JJG
I find it hard to find the logic in you writing.
i)A 10 % pullback is around 2650p and would also be the area of a 50 % retracement. You are writing 10% = 2723 and that this would be a 50% retracement.
ii)The probability of 40 % is shown on the chart to the event of the pullback reaching 2723p. In your writing the measured down to 2650 has also a 40 % probability.
BR.
Kent
Your reaction is your radar telling you that you believe that the Emini is in a trading range. Having that type of radar is very helpful as a trader.
In trends, things tend to be clear. In a trading range, they are never clear. A trader makes more money if he uses a lot of flexibility, and your comment correctly highlights the lack of clarity. That is a good thing. That is why I use loose approximations. I expect the market to either greatly undershoot or overshoot any target, and I expect surprisingly big moves and big, abrupt reversals. I also expect tight trading ranges with lots of small reversals lasting 5 – 20 days. I am open to anything when the market is in a trading range. However, what is most important is that I expect every strong move up or down will reverse and disappoint traders who want a trend.
As to the math, I did not put specific price targets because then traders would focus on them and assign unrealistic probabilities to them. That is a mistake in a trading range. It is better to think of several support levels below and several resistance areas above as creating buy and sell zones.
The exact 50% retracement of the 4 month rally is 2641.75. The exact 10% selloff is 2660.40. Each higher low in the 4 month rally, each minor high, and every gap is also a target. There are also measured move targets up and down.
The low end of the buy zone is around 2600. The high end is the March 21 high. The Emini fell below that high a few weeks ago and is now in the buy zone. But, there is no credible bottom or strong reversal up yet. Consequently, the Emini will probably test lower support. A common important magnet is a big gap, like above February 11.
When any market is in a trading range, there is a 50% chance that the 1st breakout up or down will fail. If there is a reasonable buy or sell setup, there is a 40% chance of a swing trade and a 30% chance of a major trend.
The key to trading a range profitably is to buy low, sell high, take quick profits, and expect confusion and disappointing follow-through. It sounds like you are analyzing this correctly.