Trading Update: Friday May 20, 2022
Emini pre-open market analysis
Emini daily chart
- Wednesday bear breakout bar and yesterday’s weak bull doji bar add further confusion to the market and increases the odds of more trading range price action
- The bears got disappointment after Wednesday’s big bear breakout bar.
- The bulls hope that yesterday is a credible double bottom with May 12; however, yesterday is a doji bar with a small bull body. This increases the odds of sellers above.
- The bear’s problem is that the market is at support (May 12) and will have to bounce soon if the bears do not get a downside breakout.
- Al mentioned in the trading room yesterday that a lot of consumer stocks such as Walmart (WMT), Proctor and Gamble (PG), and Target (TG) all had big gap downs and strong bear breakouts. There are several other consumer stocks not mentioned. However, the point for bringing this up is that those stocks listed above will likely have to go down for 2-3 legs, which could take a month. This means that the consumer staple sector of the S&P Index will weigh down the rest of the index. This could make it challenging for the S&P Index to rally all that much for the next month. This will increase the odds of trading range price action on the daily chart.
- Today is Friday, so weekly support and resistance are important.
- The bears want the week to close on its low. Right now, the market is around 3940. The bulls want today to close above the week’s midpoint, about 3980. This would disappoint the bears.
- Overall, traders should expect sideways to up over the next couple of trading days unless the bears can get their bear breakout.
Emini 5-minute chart and what to expect today
- Emini is up 40 points in the overnight Globex session.
- The Globex market has been in a tight bull channel since yesterday’s U.S. session.
- The bulls will try hard to get a strong bull trend day today, which would disappoint the bears on the daily and weekly chart.
- The bears want the opposite, and for today to be a bear trend day, and they want the weekly chart to close on its low.
- As usual, traders should expect trading range price action on the open. They should ensure they are not buying too high or selling too low if the day is a trading range day.
- If the market is going to be a strong trend day up or down, there will be plenty of opportunities to enter in the direction of the trend.
- Most traders should wait for a credible stop entry such as a double bottom/top, wedge bottom/top, or a strong breakout with follow-through that is clearly breaking out of the range.
- Also, if one has trouble trading the open, remember these three probabilities. Bar 1 only has a 20% chance of being the high or low of the day. There is an 80% chance of at least a minor reversal on the open. There is a 50% chance of a major reversal on the open. This means that there is a 50% chance that the initial move on the open will completely reverse and an 80% chance that the initial move will have at least a minor reversal.
- If traders find themselves losing money on the open, they should consider waiting for 6-12 bars and make sure they are not buying too high or selling too low on a trading range open.
- Lastly, as I stated above, today is Friday, so that the weekly chart will be important, especially in the final hours of the week.
- A good rule of thumb is to assume on Friday, there is an increased risk of a surprise breakout in the final 2 hours of the day due to the weekly chart. The same goes for the last 2 hours of the month (monthly chart).
Yesterday’s Emini setups

Al created the SP500 Emini charts.
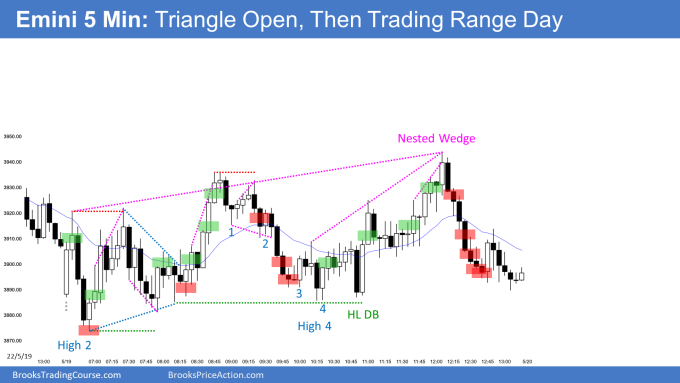
Here are several reasonable stop entry setups from yesterday. I show each buy entry with a green rectangle and each sell entry with a red rectangle. Buyers of both the Brooks Trading Course and Encyclopedia of Chart Patterns have access to a much more detailed explanation of the swing trades for each day (see Online Course/BTC Daily Setups).
My goal with these charts is to present an Always In perspective. If a trader was trying to be Always In or nearly Always In a position all day, and he was not currently in the market, these entries would be logical times for him to enter. These therefore are swing entries.
It is important to understand that most swing setups do not lead to swing trades. As soon as traders are disappointed, many exit. Those who exit prefer to get out with a small profit (scalp), but often have to exit with a small loss.
If the risk is too big for your account, you should wait for trades with less risk or trade an alternative market like the Micro Emini.
EURUSD Forex market trading strategies
EURUSD Forex daily chart

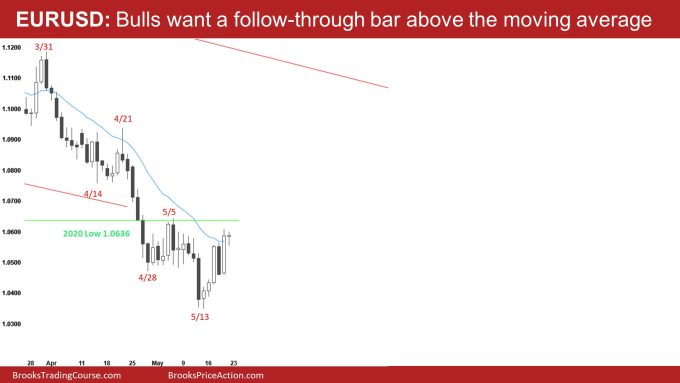
- The bulls closed above the 20-period exponential moving average yesterday. The bulls hope they can get a strong follow-through bar today, which might make the market always in long depending on the size of the follow-through bar.
- The bears want today to close on its low and reverse yesterday’s bull trend bar.
- Overall, the bulls have a credible final flag set up with the 10-bar tight trading range from April 28 – to May 11).
- Ultimately, the market will likely reach the March – April trading range lows.
- Today is Friday, so the weekly chart is important.
- Right now, the bulls have a strong bull close, completely reversing last week. Bulls want the market to close near this week’s high, and the bears want a selloff today, which would create a tail on the weekly chart.
Summary of today’s S&P Emini futures price action and what to expect tomorrow

Al created the SP500 Emini charts.
End of day summary
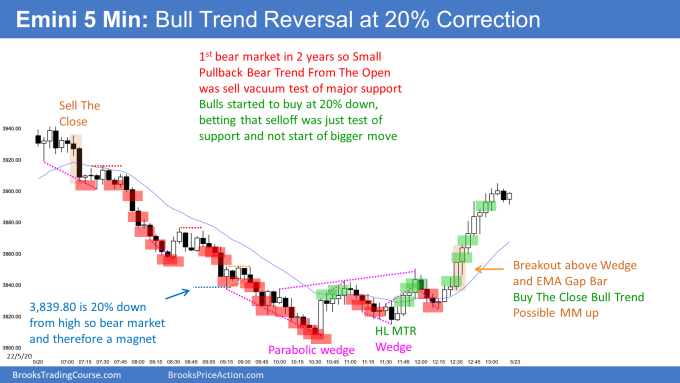
- Today was a bear trend that reversed up into the close.
- The market finally reached a 20% correction where it found buyers betting on a bounce. Traders bought the selloff because they believed it was a sell vacuum test of support (20% correction).
- On the open, the bears got a strong breakout (bar 8) below the moving average around 7:05 PT. While the follow-through after the bear breakout was sideways and disappointing, the bar 8 bear breakout was strong enough for traders to expect a second leg down.
- The market went below yesterday’s low during the 8:00 selloff, and the market was sell the close, so traders were betting on a second leg down.
- The market formed a parabolic wedge bottom around 10:30 PT, after consecutive sell climaxes, which increased the odds of ten bars and two legs up.
- The bulls were able to get a successful higher low major trend reversal that broke out to the upside in the final hour of the day, making the market buy the close for the rest of the day.
See the weekly update for a discussion of the price action on the weekly chart and for what to expect going into next week.
Trading Room
Traders can see the end of the day bar-by-bar price action report by signing up for free at BrooksPriceAction.com. Al talks about the detailed S&P Emini futures price action real-time throughout the day in the BrooksPriceAction.com on trading room days. We offer a 2 day free trial.
Charts use Pacific Time
When times are mentioned, it is USA Pacific Time. The Emini day session charts begin at 6:30 am PT and end at 1:15 pm PT which is 15 minutes after the NYSE closes. You can read background information on the market reports on the Market Update page.
I can’t believe that you would kick me out of the FB study group.
That’s what I get for asking question?
Unreal…
Al Smolkin, I am not sure what you are talking about.
I do not have any control over any FB study group regarding who gets to be a member or not, so I would take that up with the admin of the that particular FB group.
If you have any questions regarding today’s blog post, please comment below and I or others will be happy to comment.
Brad, it was your comment that promoted my getting kicked out, and, now, I’m no longer even allowed to see the Facebook group.
Well done!
Is there somewhere I can download the “Summary of today’s S&P Emini futures price action” charts for the last month or year(s)?
Hi Lars,
Detailed Daily Setups charts are not available for download but are available to view online in the Daily Setups presentations under “Online Course” menu.
BTC members see charts up to end of previous month (updated each month end). Brooks Encyclopedia members see latest charts.
Would it be a crazy notion to make them available for download?
It’s quite time-consuming to go through each and every post, richt click the picture and save it. (which is what I’m doing right now…)
I’ll answer in one word: piracy.