Trading Update: Tuesday December 6, 20222
Emini pre-open market analysis
Emini daily chart
- The market sold off to the 4,000 big round number and the apex of the November 15 tight trading range, which was a final flag.
- The past three days have formed a three-bar bear micro channel, reversing most of the November 30 bull breakout.
- The three-bar bear micro channel increases the odds of a small second leg down and test of the November 30 low.
- The market may have to test the November 1 high breakout point gap soon. If both bulls and bears expect this, the market may vacuum down to the November 1 high before buyers come in.
- At a minimum, the market will probably have to reach the November 30 high. This is because it is the third leg up after a wedge top (November 1, November 15, and November 30), and the market will typically test the low of the third leg. There will likely be buyers at the November 30 low for at least a scalp.
- If the bears break strongly below the November 1 high, the market could fall quickly down the November lows.
- Overall, the market will probably have a few legs sideways to down, testing the November 30 low at a minimum over the next couple of days.
Emini 5-minute chart and what to expect today
- Emini is up 2 points in the overnight Globex session.
- The market has been going sideways in a trading range for most of the Globex session.
- For the reason stated above, the bears want continued follow-through today and a close below the open of the day.
- Traders should expect a limit order open and consider not trading for the first 6-12 bars.
- Traders can also wait for a credible stop entry, such as a double top/bottom or a wedge top/bottom.
- If the market does get a downside breakout on the open, below yesterday’s low, traders will see the breakout as a possible final flag and look for an opening reversal up.
- Overall, traders expect a lot of trading range price action today, especially after yesterday’s strong selloff.
EURUSD Forex market trading strategies
EURUSD Forex daily chart

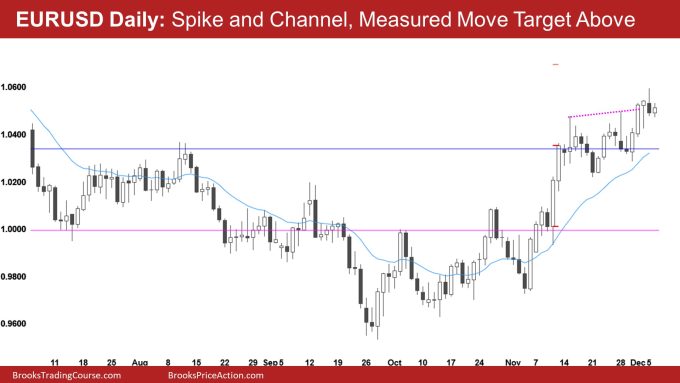
- The EURUSD is forming a wedge top after the November 10 and 11 bull breakout.
- The bears want two legs down at a minimum. Next, the bears want a downside breakout below the November 21 low.
- Yesterday is a bear bar closing on its low and a possible third push-up, which is good for the bears. This increases the odds that bulls may exit below. The problem for the bears is that yesterday’s bear signal bar is part of a four-bar bear micro channel which will lower the probability for the bears and increase the odds of a second leg up.
- Overall, traders will pay close attention to today. Bulls may buy above if today is a strong High 1 buy signal bar. However, if today is a weak high 1, such as a doji bar or a strong entry bar for the bears, that will increase the odds of the market staying below yesterday’s high for a few bars.
Summary of today’s S&P Emini futures price action and what to expect tomorrow

Al created the SP500 Emini charts.
End of day review
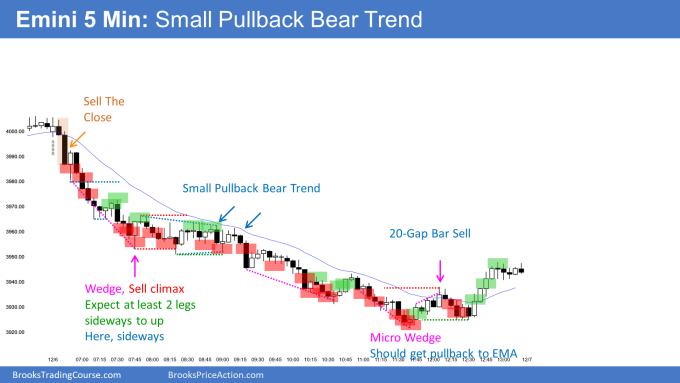
- Today was a trend from the open, small pullback bear trend day that lasted all day.
- On days like today, it is essential to recognize how tight the channel is and only consider buying after a strong trendline break closing above the moving average.
- While the market formed a parabolic wedge bottom around 7:45 AM PT, the best the bulls could get is sideways to the moving average.
- In general, when the market is in a small pullback bull trend, traders should assume that every buy signal will lead to sideways trading until proven otherwise.
- Part of the challenge with small pullback bear trends is that the market always looks like it will reverse up.
- All the buy signal bars cause bears to buy back shorts and bulls to commit longs. Both of these traders get trapped. Bulls get trapped into a losing trade, and bears are trapped out of the market. This means that both sides look to sell a pullback which is, in part, why one never comes.
- The bears were able to get follow-through after yesterday’s selloff, which is a sign of strength by the bears.
- Overall, today was a good day for the bears. The market went below the November 30th low and the November 1st breakout point high on the daily chart.
- Traders should assume the bears will become disappointed soon, and the market will go sideways for a few days.
- Since the market is forming a bear microchannel on the daily chart, the market will probably need at least a small second leg down before the bulls can regain control, especially since the daily chart is forming a wedge top.
See the weekly update for a discussion of the price action on the weekly chart and for what to expect going into next week.
Trading Room
Traders can see the end of the day bar-by-bar price action report by signing up for free at BrooksPriceAction.com. Al talks about the detailed S&P Emini futures price action real-time throughout the day in the BrooksPriceAction.com on trading room days. We offer a 2 day free trial.
Charts use Pacific Time
When times are mentioned, it is USA Pacific Time. The Emini day session charts begin at 6:30 am PT and end at 1:15 pm PT which is 15 minutes after the NYSE closes. You can read background information on the market reports on the Market Update page.