Market Overview: Weekend Market Update
The Emini has a nested double top, but a minor reversal to below the 2940 ledge top is more likely than a bear trend.
Crude oil had a brief rally and then reversal down this week. The rally was strong enough. The rally was strong enough to make at least a small test back up likely.
The EURUSD Forex market has been sideways for 3 weeks at the bottom of its yearlong bear channel. Since it is at the bottom of the channel, it will probably bounce soon, but it might continue sideways for another week or two first.
Crude oil Futures daily chart:
Pullback from bull breakout, but still in trading range
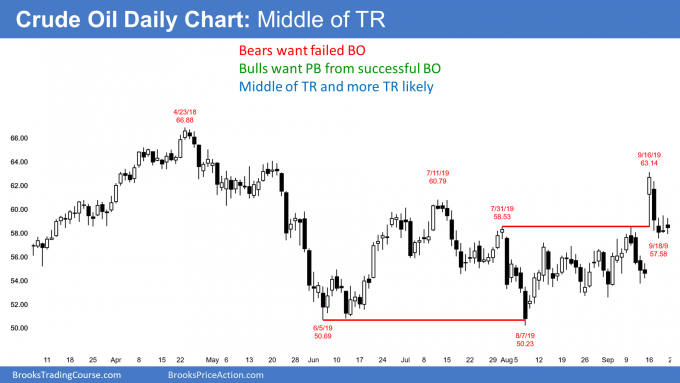
The crude oil futures jumped 15% on Monday after the attack on Saudi Arabia’s oil production facilities. While dramatic, crude oil gave back half of the gain on the next day. As big a move as it was, it is not noticeable on the monthly chart and unremarkable on the weekly chart.
Crude oil has been in a tight trading range for 4 years. Furthermore, it has been forming lower highs and higher lows for 2 years. It is therefore at the apex of a triangle on the weekly chart.
Every tight trading range is a Breakout Mode pattern. The apex of a triangle is an example. Traders know that it is a balanced market. Control alternates between the bulls and bears.
What happens with a breakout from a Breakout Mode pattern?
At some point, there is a breakout. Traders know 3 things about the breakout. First, there is a 50% chance that the 1st breakout will fail. Second, there is an equal chance that a successful breakout will be up or down.
Finally, until there is a breakout, there is no breakout. Most breakout attempts will reverse. They bet against breakouts by selling strong rallies and buying strong sells. Additionally, since they believe moves up and down will not last, they take quick profits. This results in a continuation of the trading range.
Bull Surprise Bar typically will lead to a 2nd leg sideways to up
This week’s rally was surprisingly strong on the daily chart. A Surprise Bar or Breakout means that it was unlikely. Traders were therefore not positioned correctly for it.
There were bears who sold early in the bull breakout, betting it would not get far. Now that it has, these bears are trapped into a bad short. They will therefore buy this reversal down to exit their shorts with a smaller loss.
The bulls were also not expecting as big a bull breakout. Many did not buy, but are hopeful that it is the start of a bull trend. These bulls will also buy this week’s pullback, but they are buying to get long.
There are other bulls who bought at the top of Monday’s rally. They were confident that either the rally would continue and they could make a profit, or there would be a pullback and the chart would enter a trading range.
These traders believed that the rally was strong enough to make an immediate bear trend unlikely. They could then buy more lower and exit on a test back up to the top of the range. They would get out around breakeven on their 1st buy and with a profit on their lower buy.
At least small 2nd leg up likely soon
With both the bulls and bears buying the reversal down, the odds favor a 2nd leg sideways to up. Will the 2nd leg up form a double top and then lead to a swing down for a few weeks? Or will it test the next resistance at the June high, just below 67?
In either case, most breakout attempts fail. Therefore, this rally will probably not lead to a trend up to the October 3, 2019 high above 78. Big Up, Big Down creates Big Confusion. Traders expect more sideways trading between 50 and 65.
EURUSD weekly Forex chart:
Tight trading range at bottom of bear channel
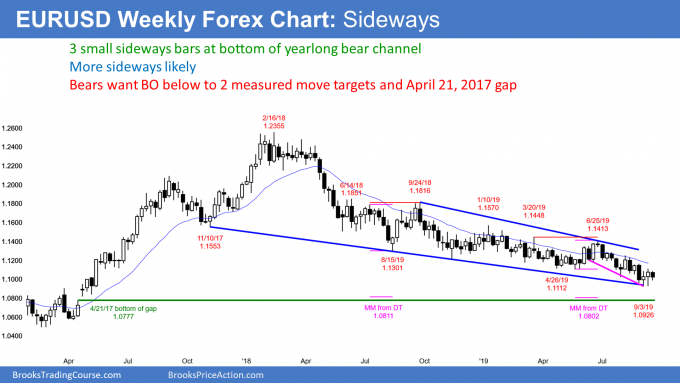
The EURUSD weekly Forex chart formed 3 sideways small bars over the past 3 weeks. Two were dojis. This is a neutral pattern. Because the bars are sitting on the bottom of the yearlong bear channel, traders expect a bounce. But their small bodies indicate that there is no enthusiasm for a reversal up. Since they are going sideways at support, next week will probably be sideways as well.
A bear channel is a series of lower highs and lows. This channel has had many legs up and down, each lasting a few weeks. There have also been many tight trading ranges lasting for a month or two. The weekly chart is now in one of those periods.
The bulls want a reversal up to the top of the channel. That is currently around the 1.1250 August 6 major lower high.
But they need more than that to end the bear channel. The June 25 high of 1.1413 is more major. Traders want to see a couple daily closes above that high before they will begin to conclude that the bear channel has ended and either a trading range or bull trend has begun. Since every rally over the past year led to a new low, traders will bet that any rally now will do the same.
Measured move targets are near April 2017 gap below 1.08
There are 2 double tops with measured move projections down at around 1.08. The first is the July/September 2018 double top. The other is the March/June 2019 double top. Two magnets at nearly the same price increase the chance of a test of that support.
It is important to note that there is a 3rd magnet around 1.08 as well. The daily and weekly charts gapped up on April 24, 2017. For the gap to close, the EURUSD will have to trade below 1.0777, which is the April 21, 2017 high. That is only about 30 pips below both measured move targets.
Furthermore, the 1st of the 3 targets is less than 100 pips below this month’s low. Support is a magnet. The closer something gets to a magnet, the stronger the magnetic pull. As some point, the magnetism is so strong that it is very difficult to escape the magnetic pull.
The EURUSD weekly chart is near that point. This bear channel will probably continue down to at least 1.08 over the next few months, even if there is a test of August high first.
Monthly S&P500 Emini futures chart:
August had bear body so it was a weak High 1 bull flag
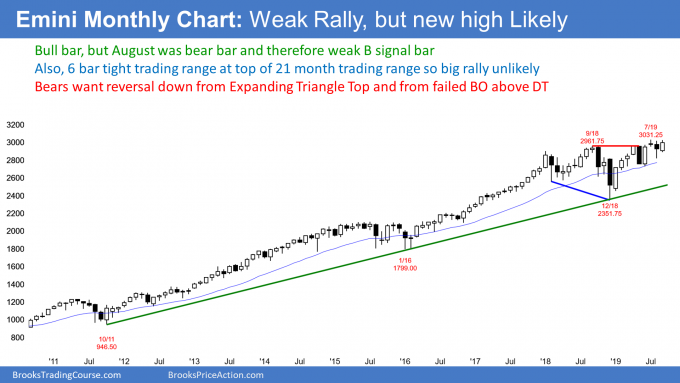
The monthly S&P500 Emini futures chart has a bull trend bar so far in September. Since June formed consecutive outside (oo) bars, I have been saying that the Emini would be sideways to up into at least September. July went above the June high and triggered the oo buy signal. A rally from an oo pattern usually continues sideways to up for at least 3 months.
Can it last longer? Three months is the minimum. But think about the pattern. Consecutive inside bars (an ii pattern) is a triangle on a smaller time frame chart. A triangle has at least 5 legs. That means that the market is spending a lot of time oscillating around a price. Traders see that price as important. It is a magnet. A breakout above or below usually reverses back to the triangle within about 10 bars.
It is important to note that an ii pattern is a traditional triangle, which means one that is constricting. An oo pattern is usually an expanding triangle on a smaller time frame chart. It, too, has at least 5 legs on a smaller time frame, and it oscillates around its middle. Again, that middle is a magnet.
Therefore, once there is a breakout up or down, there is a force that tends to draw the market back to that price within about 10 bars. This will probably limit the near-term extent of the breakout above the 21 month trading range. It could certainly continue for a few more bars, but the middle of the triangle will probably pull any rally back to the 3,000 middle of the triangle.
Weak High 1 bull flag buy signal bar
August was a pullback in a bull trend. It was therefore a High 1 bull flag buy signal bar. But it had a bear body. That lowers the probability of a big rally over the next few bars. In fact, there are often more sellers than buyers above a bear buy signal bar.
This is especially true when the buy signal is not in a strong bull trend. This one is at the top of a 21 month trading range. Traders should expect the September rally to lead to a pullback in October or November.
21 month expanding triangle top
I have mentioned many times over the past several months that there is a big expanding triangle top on the weekly and monthly charts. The sell signal triggered when August traded below July.
But July was a doji bar and that is a low probability sell signal bar. Furthermore, July just triggered an oo buy signal. Traders were going to buy below the weak sell signal bar, expecting sideways to up over the next couple months.
What happens if October is a bear reversal bar? It would then be a 2nd sell signal for the 21 month expanding triangle. A 2nd sell signal has a higher probability of leading to at least a minor reversal. This is especially true if the sell signal bar is strong in October or November. That means a relatively big bear body and a close near the low of the bar.
If the bears get that, traders would look for a test down to at least the most recent higher low. That is the August low just above 2800.
A reversal down from a major top usually has at least 2 legs. If the reversal down is strong, traders would then look for a test down to the next support, which is the June low around 2700.
Weekly S&P500 Emini futures chart: Loss of momentum at all-time high
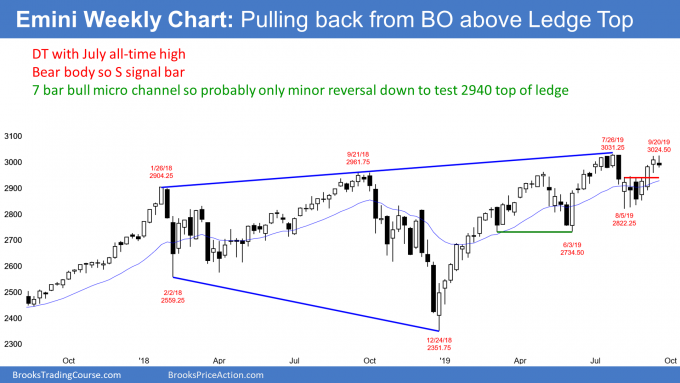
The weekly S&P500 Emini futures chart had a bear doji bar this week. This is slightly bearish compared to last’s small bull body. And last week’s body was smaller than that of the week before, which means less bullish. This is a loss of momentum over the past 3 weeks. It is not what the bulls want to see as they try to break out to a new all-time high.
This hesitation near the prior high makes traders wonder if this rally is simply a test of the prior high. A lack of momentum means a lack of buyers. The bulls are hesitating to buy at this price. If there is a strong break above the July high, many would be willing to buy higher.
Alternatively, if there is a reversal down to support, like at the top of the August ledge at 2940, many bulls will buy. Traders are now deciding if there will be a strong bull breakout or a pullback.
Breakout above ledge top means pullback likely soon
There were 4 consecutive weeks in August with essentially identical highs. That is a ledge top. It is support and therefore a magnet. Once the ledge formed, I said that there was a high probability of a breakout above the ledge.
I also said that there would be a high probability of a pullback below the top of the ledge before the rally went very far. That is still likely to happen. But traders do not know if it will happen from where the Emini currently is or from a new all-time high. This week’s bear body makes a test of the ledge top slightly more likely within a couple weeks.
If the Emini turns strongly down from here, there would be a double top with the July all-time high. If instead it breaks to a new high and then reverses, there would be a wedge top with the May and July highs.
But any reversal will more likely lead to a trading range or a bull flag than a bear trend. Traders should expect a new high witin the next several weeks. There is currently only a 30% chance that this week’s reversal down will test below 2800 before there is a new high.
Daily S&P500 Emini futures chart:
Nested double top but only minor reversal down likely
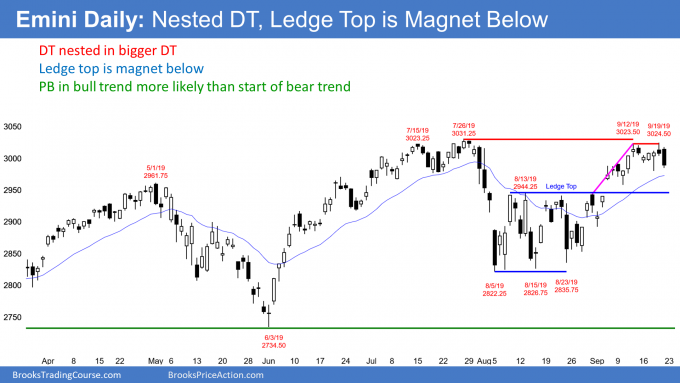
The daily S&P500 Emini futures chart triggered a sell signal on Friday by trading below Thursday’s low. Thursday was a sell signal bar for a double top with last week’s high. Furthermore, the 2 week double top is nested within a larger double top with the July all-time high.
The bears want a break below Wednesday’s low. That is the neck line of the 2 week double top. A measured move down would be near the August ledge top at 2940. A ledge top is a reliable magnet. Therefore the Emini will probably dip below that top within a few weeks. The bulls will see the test down as forming a bull flag. However, the bears want that pullback to grow into a bear trend.
Without a strong reversal down over the next couple weeks, a pullback followed by higher prices is more likely. I have been saying since June that a new all-time high was likely to come in September or October. That is still true.
However, the Emini went sideways for 4 weeks in July. It is now in that trading range. That increases the chance of more sideways to down trading over the next couple of weeks.
Trading Room
Traders can see the end of the day bar-by-bar price action report by signing up for free at BrooksPriceAction.com. I talk about the detailed Emini price action real-time throughout the day in the BrooksPriceAction.com trading room. We offer a 2 day free trial.
Charts use Pacific Standard Time
When I mention time, it is USA Pacific Standard Time (the Emini day session opens at 6:30 am PST, and closes at 1:15 pm PST). You can read background information on the intraday market reports on the Intraday Market Update page.
On Crude Daily overview you state, “there is a 50% chance that the 1st breakout will fail.” In some videos you state that most breakouts fail. Can you please clarify the difference?
I think the difference is that crude oil is breaking out from a triangle (50% probability of success) vs a BO from a trading range (which is more likely to fail).