Market Overview: Weekend Market Update
The Emini weekly chart broke above the two top attempts of the past 6 weeks. With the week gapping up and closing near its high, higher prices are likely over the next few weeks. The Emini will probably make a new all-time high within a month or two.
The crude oil weekly futures accelerated up over the past 2 weeks. The breakout is strong enough to make at least a small 2nd leg up likely after the 1st brief pullback.
The EURUSD weekly Forex chart is waiting for news from Brexit. It could come suddenly at any time. Until then, traders will look for reversals every 2 – 3 weeks.
Crude oil Futures market:
Accelerating up
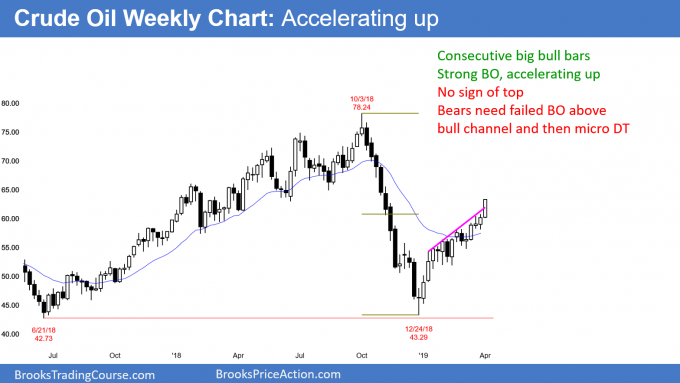
Crude oil futures have rallied strongly for 3 months. The rally has been especially strong since early March. There are now 5 consecutive bull trend bars on the weekly candlestick chart.
This week’s candlestick was a big bull trend bar that closed on its high. It followed a good buy signal bar last week. This is a new breakout. There will be trapped shorts who will be desperate to buy the 1st small pullback. Consequently, the odds favor at least a small 2nd leg up after the 1st 1 – 2 week pullback.
While a strong breakout is unsustainable and climactic, there is no top yet. Higher prices are likely. Buy climaxes eventually entice bulls to take profits. Once the profit-taking begins, there will probably be a pullback lasting 1 – 2 months.
When a bull channel is tight, it usually has to transition into a trading range before it can reverse into a bear trend. Therefore, the weekly chart will probably have to to sideways for many weeks before the bears can create a significant swing down.
EURUSD weekly Forex chart:
Imminent breakout up or down on Brexit news
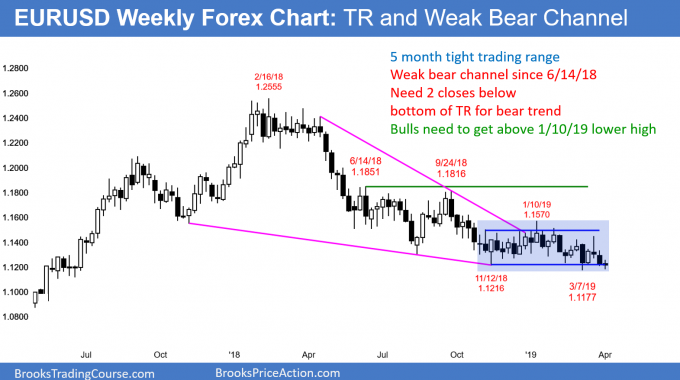
The EURUSD weekly Forex chart has sold off from the June high in a week bear channel. It now has been in a tight trading range for 5 months. Every leg up and down has reversed within 2 – 3 weeks. This is the longest time in a trading range in over 2 years. As a result, traders expect a breakout soon.
Obviously, everyone is expecting Brexit to be the catalyst that leads to the breakout. However, it is a mistake to assume that either the bulls or bears currently have an advantage. The market could not be going sideways if it was more likely to go up or more likely to go down. It is going sideways because the bulls and bears are equally strong. They have been alternating control every few weeks.
Because the daily chart is now at the bottom of the trading range, the odds favor sideways to up over the next week. But news from Brexit can convert the 5 month trading range into a bull or bear trend in an instant.
Trading range means Breakout Mode
The chart is in Breakout Mode. When that is the case, there is a 50% chance that the 1st breakout will fail. Furthermore, there is a 50% chance that once there is a successful breakout, it will be up, and a 50% chance it will be down.
There are several choices for the top and bottom of the range. This matters because traders expect a measured move up or down once there is a breakout. The 4 month range is about 350 pips tall. Therefore the measured move targets are around 1.08 for the bears and about 1.19 for the bulls.
It is important to remember that there is no breakout until there is a clear breakout. In the meantime, it is better to bet on reversals.
Monthly S&P500 Emini futures chart:
Testing all-time high and regaining momentum up
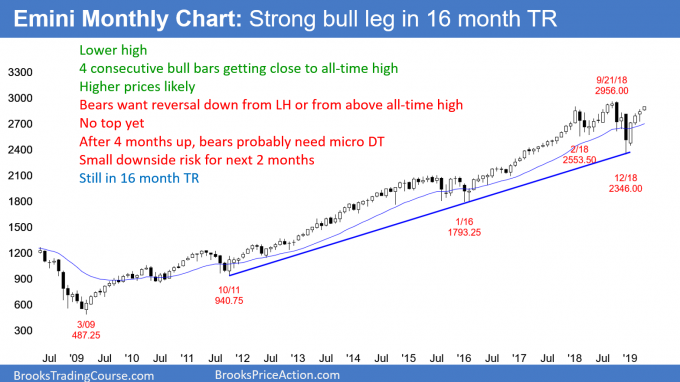
The bodies of the Emini futures monthly candlesticks have been shrinking for 3 months. This is a sign of a loss of momentum and it increases the chance of a pause in the rally. I wrote last week that because last month was a doji bar, it was a one bar trading range.
Trading ranges tend to continue and this increases the chance of another sideways bar in April. I said that April might test both last month’s high and low. It is currently above last month’s high. If the Emini is to test the March low in April, it would have to reverse down in the next couple of weeks.
Can the momentum pick up again? Can April be a bull trend bar with a big body and a close above the March high? Yes, but there are several weeks left to the month. This gives plenty of time for the bears to reassert themselves. At the moment, the odds now favor a test of the all-time high in April or May.
The importance of the size of body on April’s candlestick
If the month continues to hold near its high, the Emini will probably make a new all-time high in April or May. However, if it turns down and the month closes near its low, the Emini will probably be sideways to down for at least another month.
I have been writing over the past 2 months that the reversal up from the 10 year bull trend line would probably lead to a new high this year. What we don’t know yet is if the rally will go straight up without a pullback or first pull back for a couple months. Traders will have a better idea near the end of April once they see whether the month is holding at the high or has reversed to its low.
Possible Final Bull Flag and Expanding Triangle top
The 3 month rally has been extreme and it is late in a 10 year bull trend. That makes the yearlong trading range a good candidate for a Final Bull Flag. Therefore, if there is a new high, the 2018 trading range will be a magnet. Any rally above 3,000 will probably get drawn back down to the middle or bottom of the yearlong trading range by the end of next year.
If there is a reversal down from a new high, there would be an Expanding Triangle top of the weekly and monthly charts. The initial target for the bears would be the bottom of the triangle, which is the December low. A selloff from a new high to that low could take many months after a reversal down.
If there is a bear trend after a reversal down from a new high, traders will look for a measured move down . The selloff will probably reach the 2014 – 2015 trading range at around 2000. This will probably happen within the next few years.
Weekly S&P500 Emini futures chart:
Bull Surprise Bar makes higher prices likely
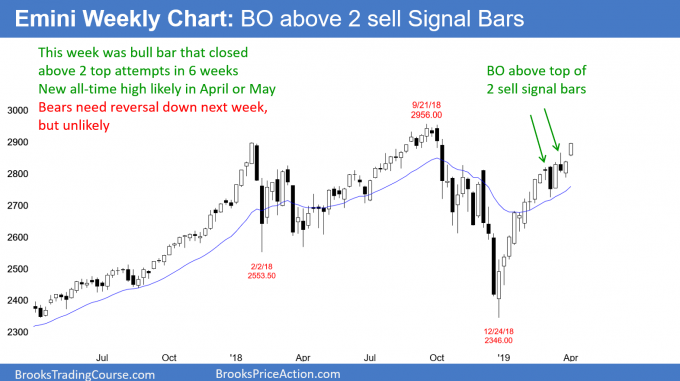
The weekly S&P500 Emini futures chart had a gap up this week. This is important because there were 2 sell signals over the past 6 weeks. The gap up this is a sign that the bulls are not yet exhausted.
The bull candlestick with a close near the high is a sign that the top-picking bears are giving up. The odds favored a pullback after 2 sell signals following a 10 week bull micro channel. But, this week broke above the sell signal bar from 2 weeks ago. Furthermore, it closed above that high and near the high of the week.
Bull Surprise Bar
This week represents surprisingly good buying pressure. Therefore, this week was a Bull Surprise Bar. A Bull Surprise Bar is a low probability event. It traps bears into losing shorts and bulls out of good longs. Both are desperate for a pullback to buy. The bears want to exit with a smaller loss and the bulls are eager to get long. This typically results in at least a small 2nd leg up.
The bigger the bar is, the bigger the surprise. This week did not have a particularly big bull body. Consequently, there is not as much desperation to buy as there might have been. As a result, the bears have a 40% chance of a reversal down next week.
For them, this week is the 3rd leg up in a 6 week micro wedge top. Also, the Emini is testing the 2900 Big Round Number. But, the bears need a strong sell signal bar next week to undo what the bulls accomplished this week. At the moment, the odds favor a test of the September 2956.00 all-time high by the end of May. It might even come within a few weeks.
Daily S&P500 Emini futures chart:
Emini nested wedge buy climax in buy vacuum
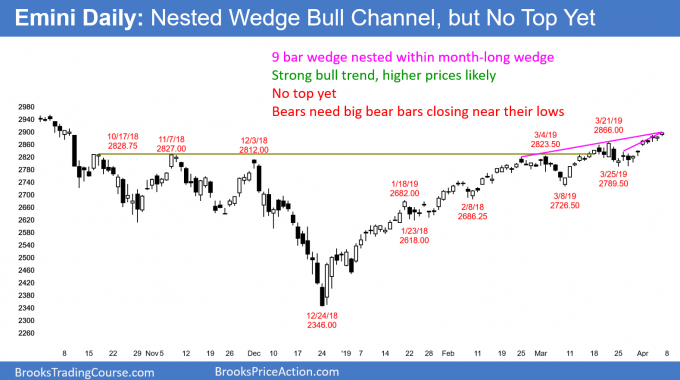
The daily S&P500 Emini futures chart rallied this week and broke above the March 21 high. This is now the 3rd leg up where March 4 was the 1st. Three legs up in a tight bull channel is a parabolic wedge.
Furthermore, this 3rd leg up is made of a smaller wedge. March 26 and April 1 are the 1st 2 legs up in this wedge. When the 3rd leg in a wedge is made of a smaller wedge, there is a nested wedge pattern. A nested pattern has a higher probability of reversing down.
But, the bears need either a credible sell signal bar or one or more big bear bars. Without either, the odds favor higher prices. Everyone is aware of the magnetic pull of the 2956.00 all-time high.
More momentum bulls than value bulls
Much of the recent buying is from momentum bulls. They are buying because the Emini is going up. These bulls see the magnet not far above and are betting that the Emini cannot escape the magnetic pull. They want to ride the momentum up for a quick profit.
These traders are not buying because they think the market is cheap. Value bulls buy when they think the market is cheap and they buy more on selloff because it is then cheaper. Late in a bull trend, if the market rallies strongly, most of the buying is from momentum bulls, not value bulls. Momentum bulls want a quick profit.
In addition, momentum bulls are risk adverse. As soon as they are disappointed by a loss of momentum, they exit. Their goal is a relatively small reward, knowing the probability is high. If the risk becomes big, their math becomes bad. They will exit to avoid a growing risk.
A trader will lose money if his risk/reward becomes bad and his probability is dropping. The result often is a rush to the exits as soon as the Emini begins to turn down late in a bull trend. The momentum bulls can exit in a panic and create a quick down draft. There were several examples in 2018.
Odds now favor a new all-time high
I have been writing since December that the bulls would probably get a new all-time high this year. Until this week, the odds favored a 2 month pullback to a higher low, and then a new high later in the year.
This week was strong enough to make the new high likely to come by the end of May. It might even come in April. However, one or two big bear days over the next few weeks could flip the odds back in favor of a 2 month pullback before a new high.
Trading Room
Traders can see the end of the day bar-by-bar price action report by signing up for free at BrooksPriceAction.com. I talk about the detailed Emini price action real-time throughout the day in the BrooksPriceAction.com trading room. We offer a 2 day free trial.
Charts use Pacific Standard Time
When I mention time, it is USA Pacific Standard Time (the Emini day session opens at 6:30 am PST, and closes at 1:15 pm PST). You can read background information on the intraday market reports on the Intraday Market Update page.