Market Overview: Weekend Market Update
The Emini is again stalling around 3,000, just below the all-time high. Traders need more information before they decide between a new high and a pullback. That increases the chance of more sideways trading next week.
The 30 year Treasury bond futures chart is near the bottom of a developing trading range after the August buy climax. It should bounce here or soon.
The EURUSD weekly chart is having its strongest rally since the bear trend began in February 2018. Traders expect higher prices and will buy the 1st 2 – 3 week pullback.
30 year Treasury bond weekly futures market:
2nd leg down in developing trading range
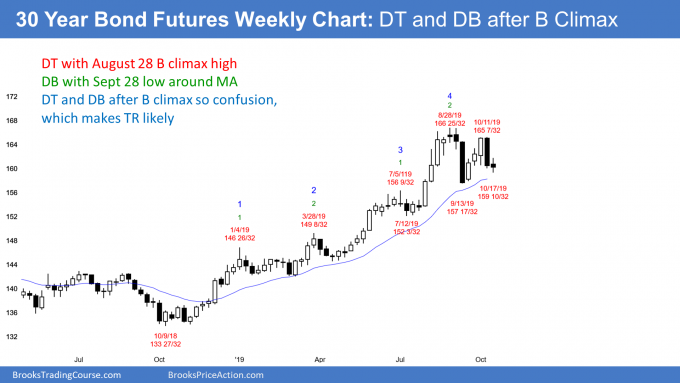
The 30 year Treasury bond weekly futures chart formed a doji bar this week after last week’s big bear bar. This is a lack of follow-through selling and it is consistent with a developing trading range.
There have been 2 reversals down and 1 up since the August parabolic wedge buy climax. The bears have a double top and the bulls now have a double bottom. That is a trading range.
While the chart is trying to reverse up, this week’s doji bar is a weak buy signal bar for next week. Therefore, there will probably be sellers not too far above this week’s high.
Trading range after August parabolic wedge buy climax
Traders expect the 2 month trading range to continue for at least a few more weeks. On the daily chart (not shown), there is a micro wedge bottom over the past 6 days. The bulls expect a bounce next week.
If the rally stalls over the next couple weeks, which is likely, there will be a triangle on the daily chart. That is a Breakout Mode pattern. That means that there is about a 50% chance of either a successful bull or bear breakout. Furthermore, there is a 50% chance that the 1st breakout up or down will fail and reverse.
Traders expect limited movement up or down and more trading range price action over the next few weeks. They are buying around the current level, betting on at least a 50% retracement of the 2 week selloff. Many will use a wide stop and scale in lower.
What about that double top and buy climax? The yearlong bull channel is tight. Also, the 3 week rally into early October was surprisingly strong. Most traders believe that the bears will need at least one more test up before they have a reasonable chance of a bear trend on the weekly chart. But if there are consecutive bear bars closing below the September low, the odds of a bear trend will go up.
EURUSD weekly Forex chart:
Strong reversal up from nested wedge bottom
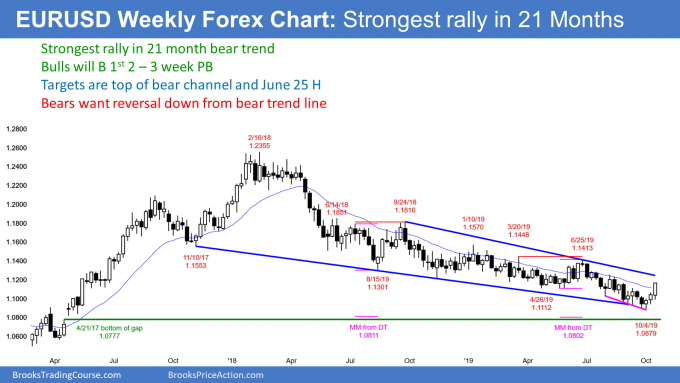
The EURUSD weekly Forex chart had a buy signal bar 3 weeks ago for a nested wedge bottom. This week was the 3rd week up and the size of the bodies has been increasing. The bulls are becoming more confident.
The bears want the rally to fail at the 20 week EMA. But the momentum up is strong. The rally will probably continue up to test the bear trend line. That is the top of the yearlong bear channel. It currently is around 1.1250. That is also around the August 6 minor lower high. Lower highs in a bear channel are resistance. They are therefore magnets when there is a reversal up.
A reversal up from a wedge bottom typically has at least 2 legs sideways to up. As a result, the bulls will buy the 1st 1 – 2 week pullback. Traders expect the weekly chart to be sideways to up for at least a few more weeks.
Is this the start of a bull trend?
Is this the end of the 2 year bear trend? The nested wedge bottom and reasonably strong reversal up are good for the bulls. This rally is a credible candidate for the start of an evolution into a trading range for a couple months.
But the bulls need to do more before traders believe that the bear trend has ended. At a minimum, they need a couple closes above the June 25 major lower high. If they achieve that, traders will conclude that the bear trend has evolved into either a trading range or a bull trend.
What should traders expect over the next couple months?
What happens in the meantime? Until the bulls clearly end the bear channel, the weekly chart is still in a bear trend. There are magnets below the October low at around 1.08. These are the gap above the April 21, 2017 high and 2 double top measured move projections in that area.
This rally is the 1st one since the 2018 high when the bulls have had 3 consecutive bull bars with big bodies and closing near their highs. That means the bulls are the strongest that they have been in 2 years.
But until there is a break above the June high, traders will assume that this rally is minor. That means either a bull leg in the bear trend or in a developing trading range. Because the 2 year bear channel is tight, the weekly chart will likely have to go sideways for several months before the bulls can create a bull trend reversal.
A bear channel is a bull flag
It is important to note that 75% of bear channels have bull breakouts. Traders should view every bear channel as a bull flag because that is how most behave. Consequently, traders are confident of a bull breakout at some point.
If the bulls finally succeed this time, the rally should continue up to the June 2019 major lower high of 1.1413. It might even reach the June 14, 2018 high of 1.1851 over the next several months. That was the start of the bear channel in the Spike and Channel bear trend that began on February 16, 2018. The spike was the 2 month bear breakout down to the May 29, 2018 low. The channel began with the 1st pullback up to the June 14, 2018 high.
When there is a breakout above the bear channel in a Spike and Channel bear trend, the rally typically tests the start of the channel. The market then usually pulls back then enters a trading range.
Monthly S&P500 Emini futures chart:
Testing all-time high
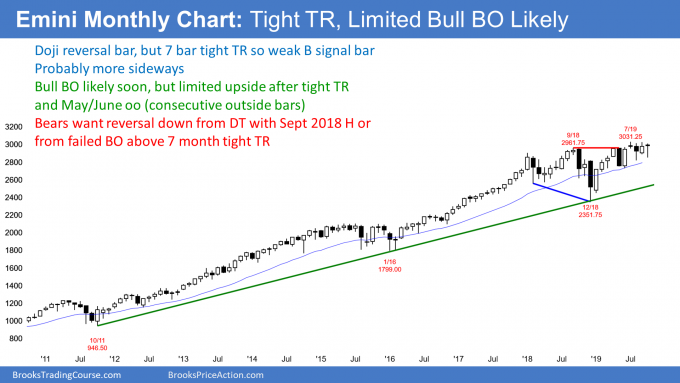
The monthly S&P500 Emini futures chart has a bull doji bar so far in October. It is at the top of its 4 month trading range, just below the all-time high. After trading below the September low, October reversed up and is now at the high of the month.
It is just below the September high. There are 2 weeks left to the month. If October goes above the September high, October will be an outside up month. That would increase the chance of higher prices in November. This is especially true if October closes above the September high.
Probably only nominal new high
Even though October is bullish and the monthly chart is in a bull trend, there will probably not be a big breakout from here. The past 4 months have been sideways around 3,000. That means the bulls and bears think 3,000 is a fair price. If the bulls break above, the rally might get pulled back to the fair price within a few bars (months).
Additionally, when July traded above June, it triggered an oo buy signal. May was an outside bar and June was a bigger outside bar. When a market breaks above consecutive outside bars (an oo pattern) late in a bull trend, the rally usually continues for a few months.
But the rally typically does not get very far before it gets drawn back to that area of agreement. The magnet is the 4 month tight trading range and the slightly lower April/May/June sideways bars. Consequently, traders will expect at least a minor reversal back to the tight trading range within a few months after breaking above it.
Small chance of trading range for another year
While the presidential election is more than a year away, the Emini might already be pricing in the result. If Trump remains president, traders might be relieved and feel more confident. That would make them more willing to buy stocks, which could lead to a rally.
Alternatively, if there is a new president, there will be uncertainty and some fear. There would probably be tax hikes and legislation that impedes business. The stock market might quickly sell off to the December 2018 bottom of the 22 month trading range.
Part of the reason for the 22 month trading range might be the uncertainty over the outcome of the 2020 election. If that is the case, the Emini might continue sideways up to the election, or until the outcome is more certain.
Since a new all-time high is likely within the next couple months, the top of the range would expand. But I gave several technical reasons why the breakout will probably not be big. If it is not big, all that the breakout would accomplish would be to nominally raise the top of the 22 month trading range.
Weekly S&P500 Emini futures chart:
Breaking above a weak High 1 bull flag
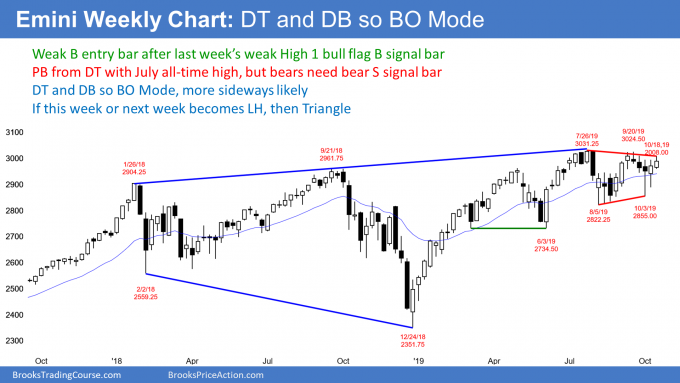
The weekly S&P500 Emini futures chart rallied strongly in 2019, but the breakout from January through May weakened and became a bull channel in June. The chart is still a bull trend and therefore traders expect higher prices. What traders do not know is how high.
This week rallied above last week’s high after a 4 week pullback. Last week was a High 1 bull flag buy signal bar. When this week went above last week’s high it triggered the buy signal.
I said last week that the setup was weak and that there might be more sellers than buyers above last week’s high. There were. This week closed below last week’s high.
Bullish, but not yet very bullish
There are several factors that reduced the bullishness of this week’s breakout. While last week had a bull body, it had a prominent tail on top. That hesitation made last week a less reliable buy signal bar.
That bar followed 3 weeks with bear bodies, which is a sign that the bears were in control for a long time. Those bear bars increase the chance that the bears will retake control within a couple weeks.
Also, the Emini is just below the all-time high. Ten of the past 14 weeks traded above the September 2018/July 2019 double top, but none has been able to break free. Until there is a breakout, there is no breakout.
The Emini has been sideways for 4 months and is now at the top of the range. If the bulls do not get a strong breakout to a new high within the next few weeks, many will be disappointed. Some will exit and look to buy again lower. If enough exit, there could be a test of the bottom of the 4 month range at around 2800.
Finally, I have written about the expanding triangle top many times. It is often a reversal pattern. There is still a 30% chance that the Emini will reverse down to the December low at some point the next 6 months
Daily S&P500 Emini futures chart:
Emini October wedge rally testing July all time high
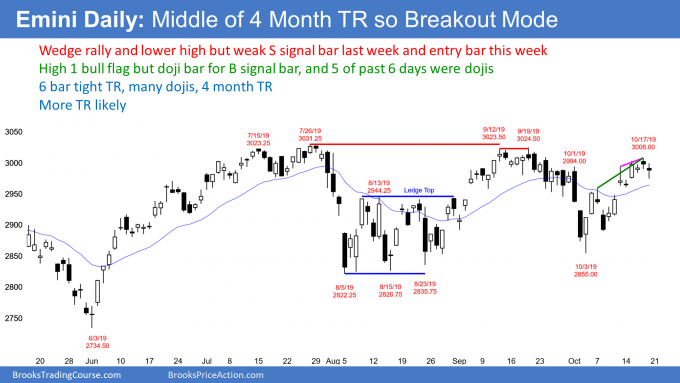
The daily S&P500 Emini futures chart is in a 6 bar tight trading range. Five of the past 6 days were doji bars. Traders expect reversals every day or two. That lowers the probability for stop entry traders.
There is a 5 bar wedge top, but Friday’s reversal down was weak. Friday is now a High 1 bull flag buy signal bar for Monday. But it has a bear body and it is in a tight trading range. This is a weak buy setup.
The Emini will probably continue sideways early next week. Traders expect a new all-time high this month. If they do not get it, many bulls will exit and wait to buy again lower. As a result, if the rally continues to stall, traders will sell, expecting a leg down in the 4 month range.
If there is a selloff from here, there would be a 2nd lower high in the 4 month range. The pattern would then be a triangle. However, the chart is already in Breakout Mode, and creating a triangle will not changes things. Until there is a breakout, traders expect more sideways price action.
White House insider trading
There is always going to be insider trading. William Cohan is a reporter for Vanity Fair and he wrote an article this week about some trading that he thinks might involve insider trading and the White House. He was on CNBC’s Fast Money on Thursday and discussed his findings.
He said that traders told him that there was a pattern of big orders being placed at the end of some days just before Trump made an announcement about the China trade deal. While not concluding that Trump or his people are trading illegally, he thinks that these trades need to be investigated. He gave 3 examples. I will discuss the 1st two.
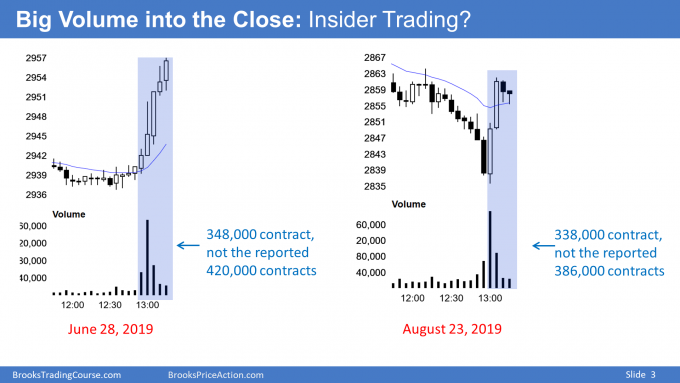
He said that on June 28, “An investor or group of investors bought 420,000 S&P Emini contracts minutes before the close.” He concluded that they probably made about $1.8 billion in profit over the next few days.
He also said that in the last 10 minutes of trading on August 23, “386,000 S&P Emini contracts crossed the wire.” He said the profit was likely about $1.5 billion over the following days. His conclusion was that there might be a coordinated effort from illegally informed individuals to profit from Trump’s upcoming tweets.
Fact check: Hyperbole
I looked at the volume in the late rallies in his 1st two examples and I am unable to confirm his facts. He said that there were 420,000 contracts traded minutes before the close on June 28. But how many minutes? If you include the selloff and enough bars, you could get his 420,000 contracts. But if you only consider the rally into the close, there were considerably fewer contracts traded.
The same problem exists on August 23. If you count the volume for the bars in the rally, there were 338,000 contracts, not 386,000 contracts. And that is over 20 minutes, not 10 minutes.
There is another problem with his reporting. The average volume over the last 5 bars every day is 100,000 or more contracts. You have to assume that at least 100,000 contracts in both of his examples was from routine trading unrelated to insider trading. Also, maybe another 100,000 contracts was from algorithms reacting to the purported unusual trading volume. Therefore, the profit from the possible fraud is considerably less than he is saying. I assume he chose hyperbole to improve his brand. Maybe there will be a book or movie deal soon.
Is insider trading possible?
There might be 100 people who know that Trump will soon release a tweet on China and trade. Also, China knows what Trump will say as well. Are all of these people honest?
You know there is insider trading going on. There was under Obama and under every president. Take hundreds of very aggressive people with huge egos and inside information. Does anyone expect them all to be honest?
There are many ways someone can profit from insider trading. One common version is that the inside person sells the information to a trader. Another is that the inside person tells someone who places trades on the insider’s behalf.
These are sophisticated people and they do their insider trading in ways that are very difficult to discover. They can use shell corporations, overseas accounts, multiple middlemen, and related assets.
For example, a trader could use the information to buy a huge amount of stocks or futures on multiple foreign exchanges. That would immediately cause buying in the Emini from firms with algorithms that instantly arbitrage against moves around the world. The Emini volume would then be from firms simply arbitraging against some international move and not from insider trading.
Conclusion: Yes, there is insider trading in the White House
Cohan’s fundamental point is correct. People are probably illegally profiting from inside knowledge of Trump’s tweets before they are released. That type of illegal activity is true of every White House. And in Congress, and every governor’s office and every mayor’s office.
However, since he is not precise about his data and he is sensationalizing the obvious, I do not think that his examples are newsworthy. I am surprised that Vanity Fair and CNBC did not fact check his claims beforehand.
Trading Room
Traders can see the end of the day bar-by-bar price action report by signing up for free at BrooksPriceAction.com. I talk about the detailed Emini price action real-time throughout the day in the BrooksPriceAction.com trading room. We offer a 2 day free trial.
Charts use Pacific Standard Time
When I mention time, it is USA Pacific Standard Time (the Emini day session opens at 6:30 am PST, and closes at 1:15 pm PST). You can read background information on the intraday market reports on the Market Update page.
Hello Al, I always enjoy these posts, and this one is more exciting than ever (!). I had a question about the 30-year bond futures– I have been watching these (UBZ9) more closely than ever over the last few weeks and find they seem to respect “your” price action models so nicely. Do you look at UB in the same way you trade ES or are you more ‘fundamental’ in your positioning? I have grown to like UB in terms of its low cost relative to its tick value, and *most* of the time it seems to respect price action very nicely (ie. exact tests of 50% pullbacks.) I did get somewhat smoked when Brexit was announced (early Europe session) and sat on my hands for 24 hours, but looking at your weekly chart this last week was a tiny range. What are your thoughts? Many thanks in advance!
I want to draw a distinction between a trade and an investment. A trade is for minutes to maybe weeks. An investment is for months to years.
I always assume that I am not smart enough to trade based on fundamental data. I could invest based on that data. I believe that the fundamentals indicate that the bond market will be lower 5 years from now and that the stock market will be higher. If I were interested in investing in them, I would short bonds and buy stocks.
Will either be lower or higher 5 hours or days from now? If I were to place a trade within that window, I would exclusively base it on price action and totally ignore the news.
The institutions are 95% of the volume. They decide on whether the news should result in an increase or decrease in price. The charts tell me what their consensus vote is. I then trade in the direction where the charts tell me price will likely go. So, yes, I trade bonds and everything else exactly like I trade the Emini and stocks.
Am I forgetting everything about H1 L1. This is a very hard consept to grasp in your course. I see several people struggle with it, so I may misunderstand.
I think if you made some extra minutes on the releated video so it is clear what is a H1 and when it triggers it would be very useful.
I think I grasp it then something like this comes along. I thought a H1 comes when the bar have a higher low (and maybe higher high? But I thought the important thing is that it stop going lower?)
If this is right Friday is the opposite of H1, as in L1? It has lower low than thursday, after the last days have had higher lows consequent (since Monday).
Does what I explain about L1 and H1 correct? (if not what is wrong?).
If it is correct is Friday a L1? Or what do I miss?
BTW, very interesting take on the inside rumours. I thought you would shrug off examples like you did. I didn’t expect the conclusion that this happens almost every week if not day.
You have a very interesting view on the trading world and the people in it. Lots of scam and also regular inside trading from government officials (which is when you write it a epiphany for me. Ofcourse this is happening.
Just one question at end. (I really only asked about H1 Friday). But this I have to ask, even you probably will hate it..
Do you really think reelection Trump (commander of false market tweets) will trigger “certainty” and a new president “uncertainty”? I can see that he do everything to make markets rise, including lying about China conversations, but as president nothing is certain imo.
I will think that institutions would prefer a president who “stay on course” even if it means regulation of the markets again, more company taxes /1% getting taxed again. But this will probably be certain and you can depend on that for 4 years. Trumps politics is not even certain after it been through courts (which seems to do Senate’s job).
You can depend that he wont leave office like Nixon, and maybe not after an eventually successful impeachment or after loosing election.
Have there actually been a certainty in the markets for more than a month since his inauguration?
I know you don’t talk politics. I know you always say that news are catalysts for set ups, not that a news moves market alone if the setup isn’t in place.
But Trump = certainty??
(I am a us politic/world politics /news junkie. I really wonder about this statement…)
I look at a High 1 as the opposite of a Low 1. Both can occur in a trend or in a trading range.
In a bull trend, the 1st pullback after any minor high is a High 1 (High 1 bull flag, High 1 bull flag buy signal bar).
In a bull leg in a trading range, it is the same thing.
A High 1 can also be the 1st reversal up in a bear trend or at the bottom of a trading range. I usually do not use that term in those cases. A High 2 is a 2nd reversal. For example, if a day sells off on the open and then reverses up within a few bars, the 1st entry is a High 1. I typically instead call it a sell climax reversal.
If there is a 2nd buy signal within a few bars, I call that a High 2 buy setup. This is true if the 2nd price is above or below the 1st. It is also true if the pullback from the 1st buy does not fall below the low of the day. An ioi and a micro double bottom are common versions. If the 2nd buy signal bar is 5 – 1- bars later and the rally up from the 1st bottom is fairly big and lasts several bars, I begin to use the term “double bottom” instead of High 2.
The same is true near the bottom of a trading range. I talk about this in the Brooks Encyclopedia of Chart Patterns in the sections about Gap Up or Gap Down and then High 2 Bottom. See the following 2 summary slides from the Encyclopedia. There are many other examples in the Encyclopedia, as well as similar setups for Low 2 tops and double tops after a gap up or down.
As for the political influence on the election, there is a consensus that Trump’s tax cuts and reduction in corporate regulations increase profits. That is good for the stock market.
Some of the democrats are proposing things that sound like they will hurt corporate profits. If it was clear that one of them would be president, the market would have to reprice itself. This would be an important factor, in addition to all of the other variables that determine the price of stocks. Ignoring all other variables that affect price, I suspect the market would drop down to the December 2018 low, which would be a 20 – 25% reduction in price.
If it becomes clear that Trump will remain president, the market would not have that negative influence. It would then look to other data to determine what price is appropriate.