Al added some comments to report
Market Overview: Weekend Market Analysis
The SP500 Emini futures daily chart is in a very strong bull trend. However, there is now an Emini parabolic wedge buy climax and it is at the top of a bull channel. This should attract some profit taking next week, but the reversal should be minor.
The EURUSD Forex weekly candlestick was a doji bar at the bottom of a yearlong trading range. The selloff might have to test below the March 9, 2020 high at around 1.15 before there is a rally for at least a month.
EURUSD Forex market
The EURUSD weekly chart
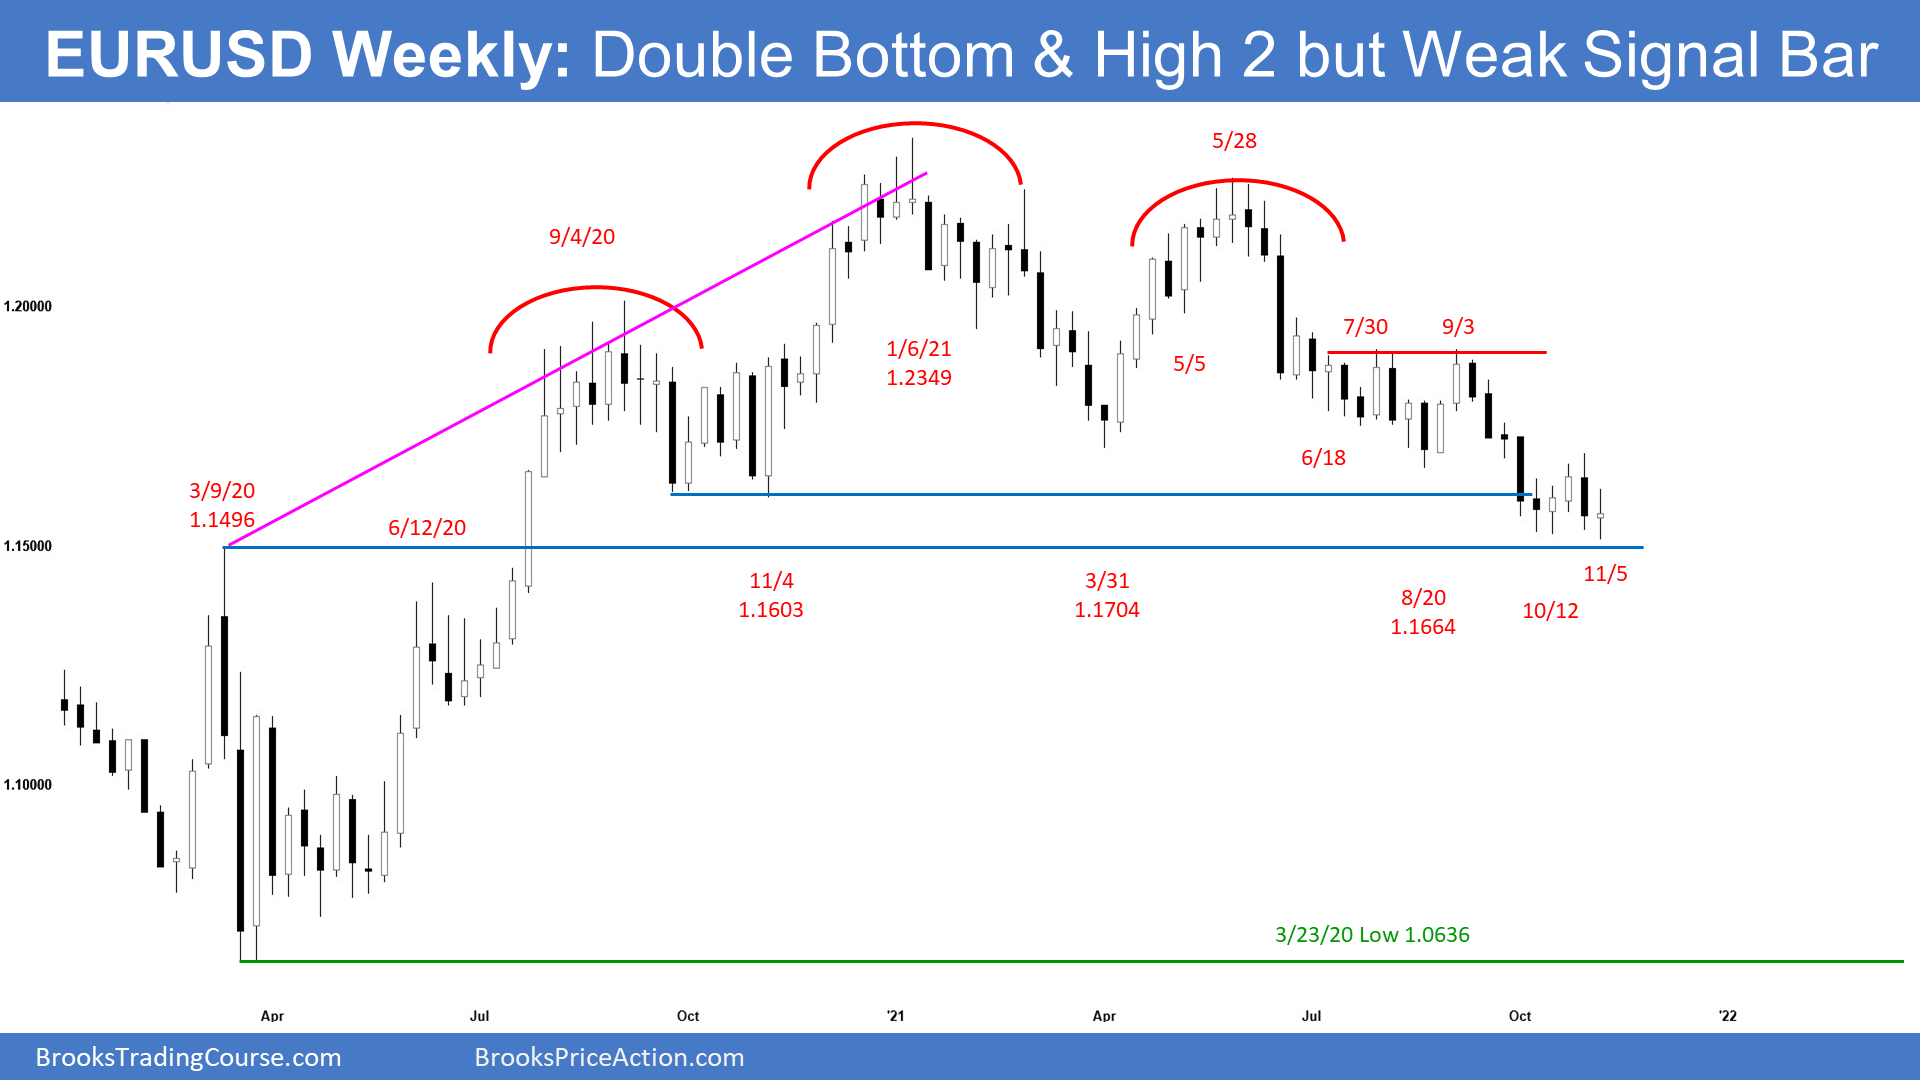
- This week’s candlestick on the weekly EURUSD Forex chart was a bull doji bar. It traded below last week’s low but reversed to close slightly above last week’s close and this week’s open.
- It is a weak buy signal bar, especially since the EURUSD has been in a tight trading range for 5 weeks.
- The EURUSD has been in a trading range for 7 years. When there is a trading range, traders look for reversals, especially after going beyond support or resistance.
- The most important support below is at the breakout points of last year’s strong rally. They are the March 9, 2020 high at around 1.15 and June 10, 2020 high at around 1.14.
- At the moment, the EURUSD will probably dip below one or both before the 6-month bear trend ends.
- The 2021 selloff is still more likely a pullback from the 2020 rally than a bear trend. There is currently only a 30% chance that it will continue down for a 700-pip measured move (based on the head and shoulders top) to last year’s low.
- Therefore, traders should expect a test back up before there is a break below last year’s low.
- It should occur from either around the current level or from around 1.15 or 1.14.
- If the bulls start to form some big bull bars, the odds will be that the reversal up has begun. Without that, it is more likely that the selloff will continue down to 1.15 or 1.14 before there is a reversal up.
The EURUSD daily chart
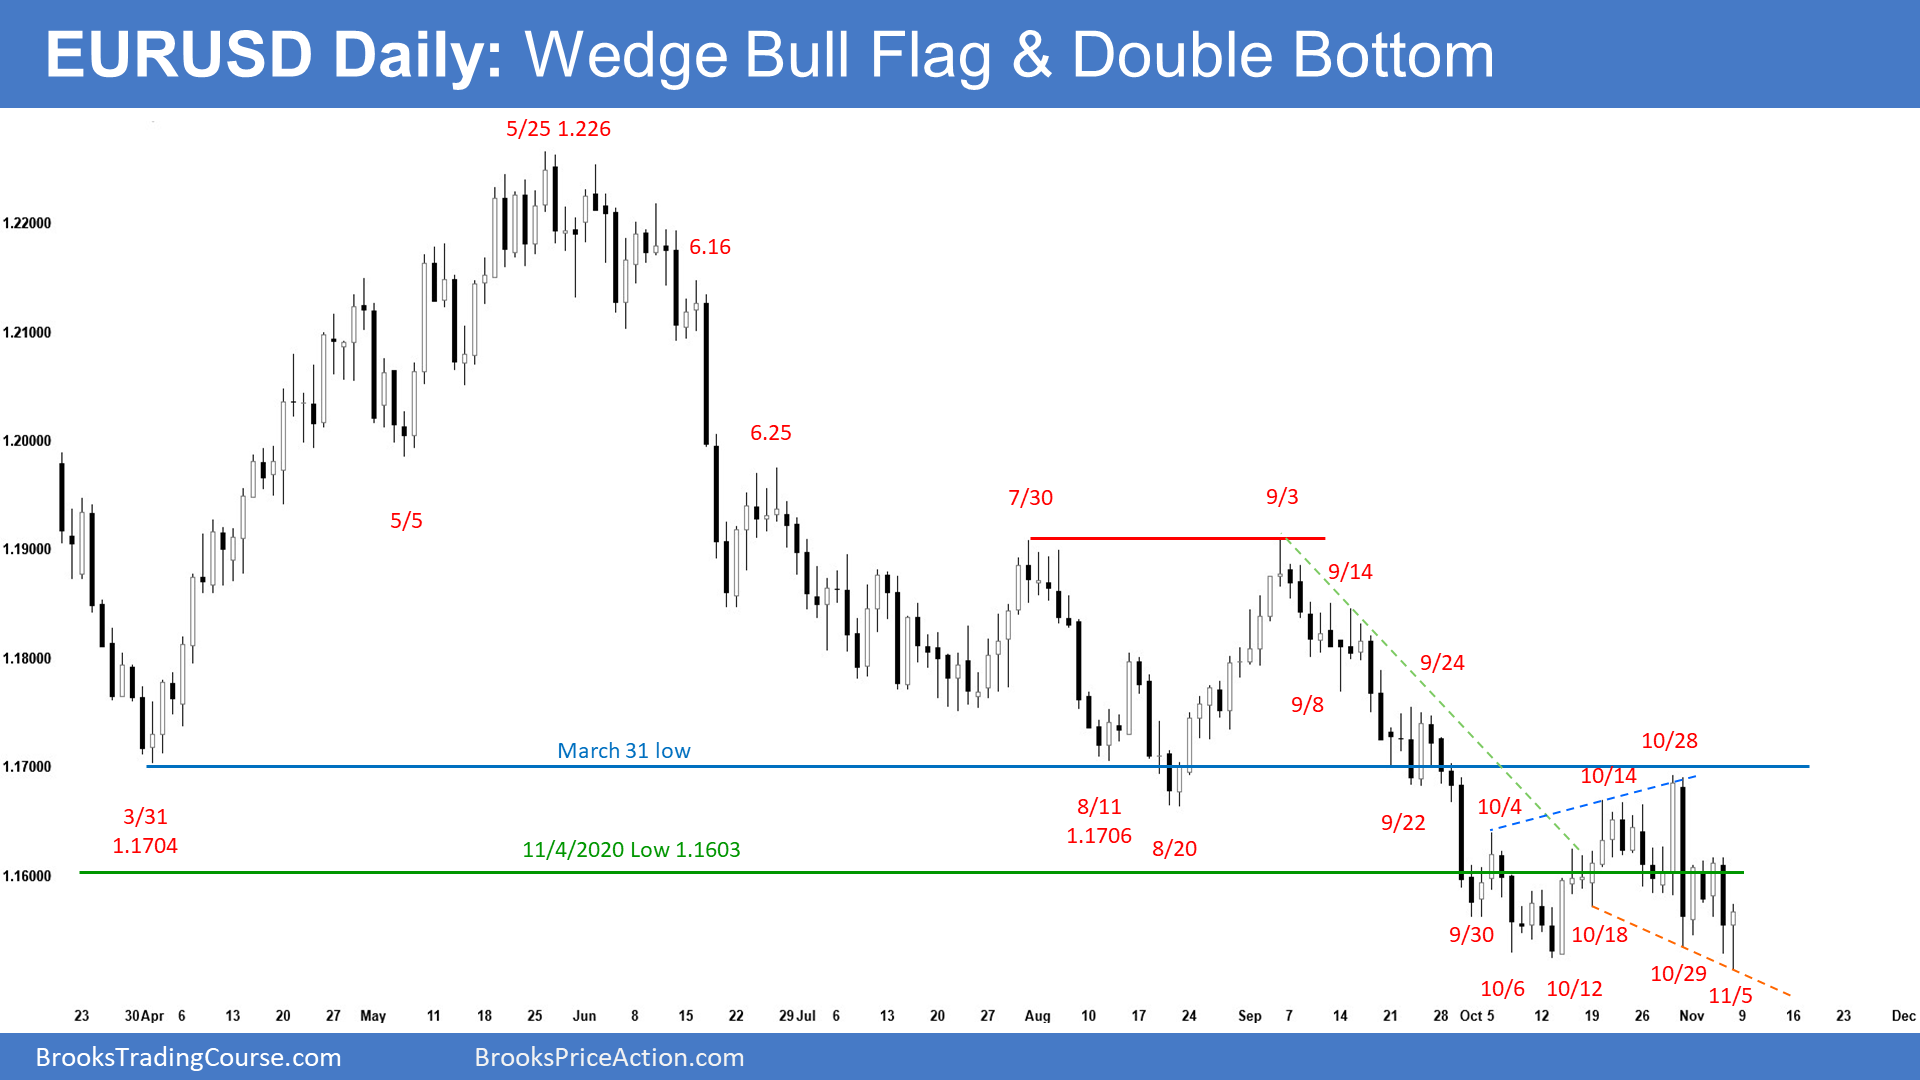
- The EURUSD formed the second leg down on Thursday after the October 29 big bear bar.
- However, Thursday’s bear bar had a big tail below and Friday was a bull doji. Also, this is at the bottom of a month-long trading range. It does not yet look like a resumption of a bear trend.
- The bulls want a reversal up from a lower low double bottom with October 12 low. They want a measured move above the October 28 neckline, which would result in a test of the September 3 high.
- There is also a wedge bull flag with October 18 and 29. When the 2nd leg down in a double bottom is a wedge, there is an increased chance of a reversal up.
- But unless the bulls begin to create several big bull bars closing near their highs, the odds are that the 7-month bear trend will continue lower.
S&P500 Emini futures
The Monthly Emini chart
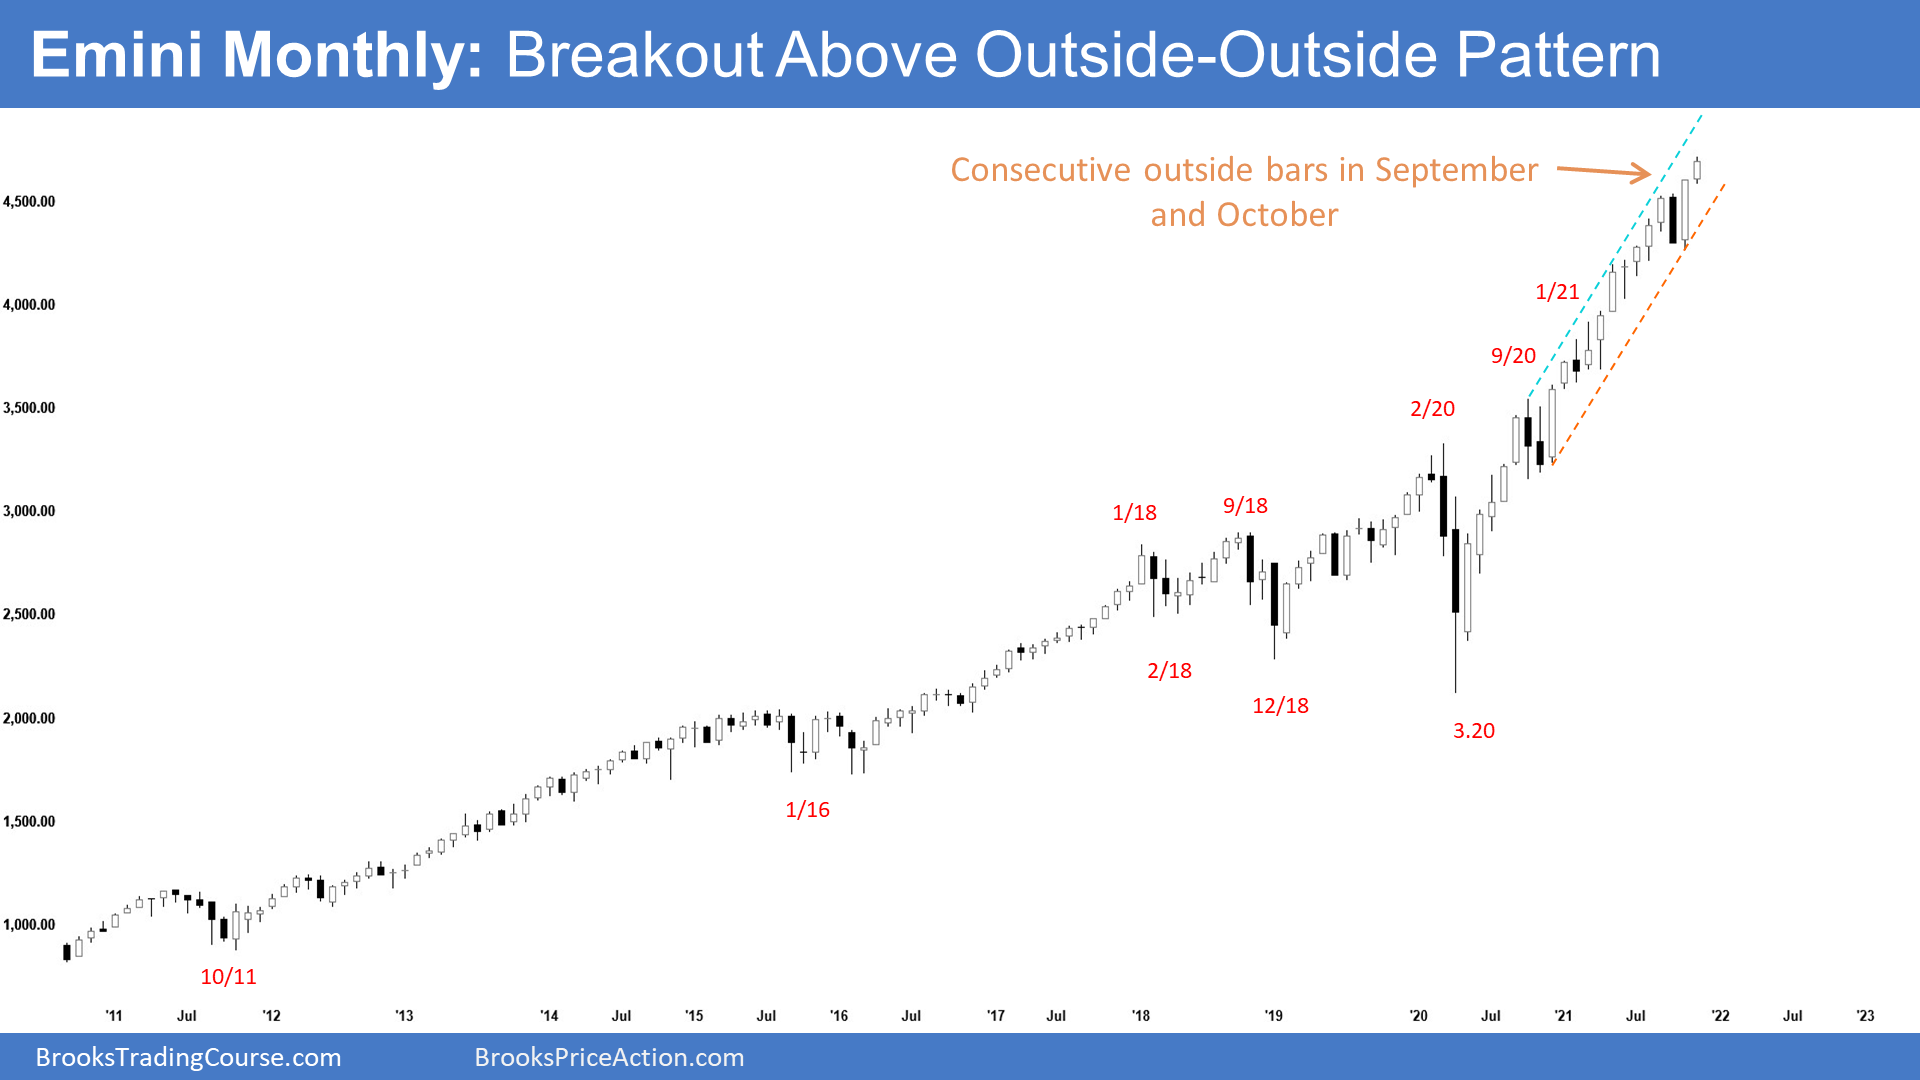
- The November monthly Emini candlestick currently is a bull bar at a new high. It so far is a strong breakout above the Sept-Oct OO (outside-outside) pattern.
- The bulls want a test of the trend channel line around 4820 and a measured move to 4934.50 based on the height of the OO pattern (which is the height of the October bar).
- September was the third time that a bear bar interrupted the strong rally on the monthly chart. A third reversal attempt has a higher probability of leading to a 2- to 3-bar sideways to down pullback.
- Al has said that most prior bear bars in buy climaxes on the monthly chart led to a 2nd bear bar within a bar or two. That means the bears hope that November rallies and then reverses down at the end of the month to close below the open of the month.
- Will that happen? With October being surprisingly strong, November will likely be another bull bar. Traders will begin to wonder if the Emini will reach the 5,000 Big Round Number before there is more than a one-month reversal.
- How much higher can the buy climax continue? Climactic rallies often last far longer than what might appear reasonable.
- An OO pattern is a pause and a brief area of agreement. It is usually an expanding triangle on a smaller time frame.
- A breakout from a triangle usually tests back to the triangle, where the bulls and bears last agreed on a fair price.
- Therefore, there is an increased chance that it will be the Final Bull Flag before there is a correction lasting at least a few bars (months).
- However, the breakout above the OO often lasts several bars before there is a reversal.
- For now, the odds favor at least slightly higher prices in November.
- However, there is always a bear case, and it always has at least a 40% chance of happening.
- But even if it does, the best the bears will probably get is 2 to 3 months of sideways to down trading before the bulls try for another leg up.
The Weekly S&P500 Emini futures chart
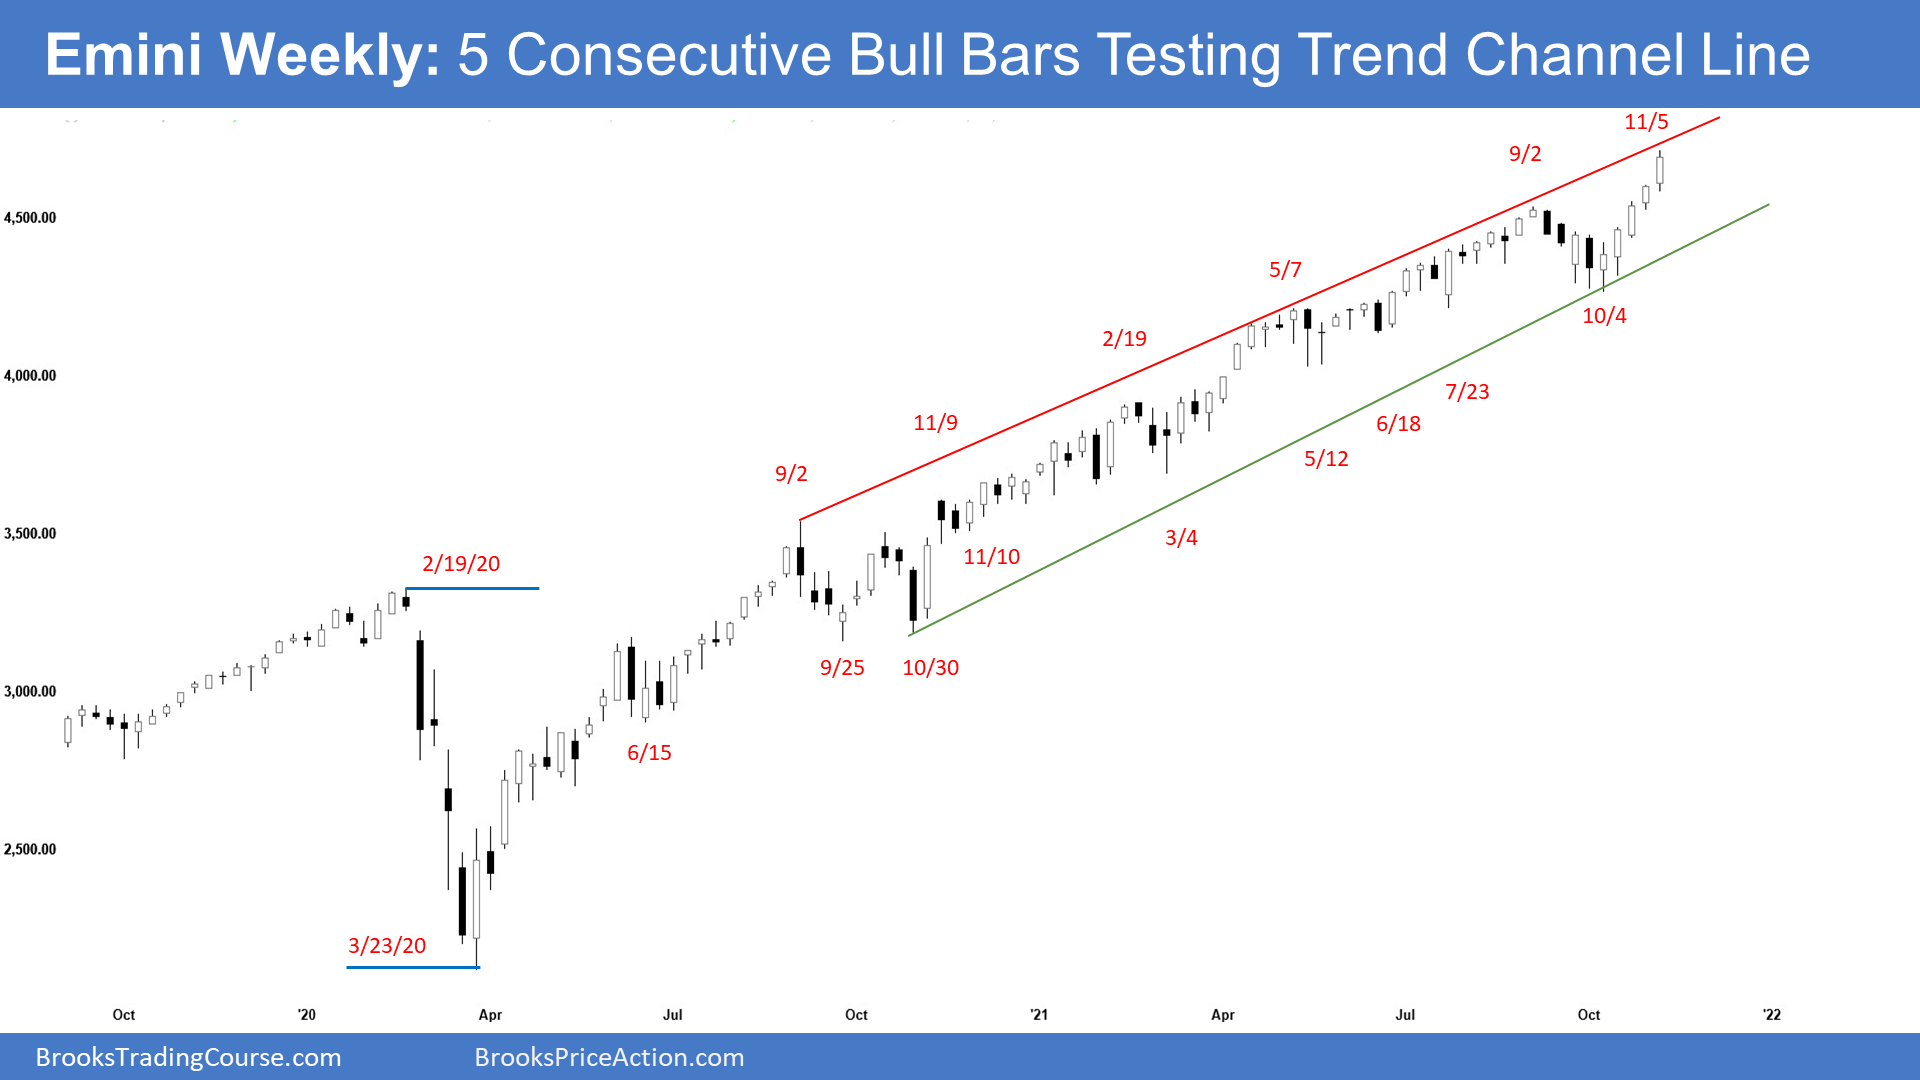
- This week’s Emini weekly candlestick was the 5th consecutive bull bar. It closed at a new high and it is testing the top of the bull channel.
- While 5 consecutive bull bars closing near its high is a strong spike, it is also climactic on the weekly chart.
- It increases the odds that we may soon see some profit taking, resulting in a sideways to down pullback.
- The next target for the bulls is 4802.00. That is the measured move target based on the height of the 4-month trading range (Jul-Oct).
- Should the Emini reach there, it would result in a trend channel line overshoot, which usually leads to a pullback into the channel after that.
- Al has said that while there was a 50% chance that the Small Pullback Bull Trend was ending in September, there was also a 50% chance that it would continue. The strong rally over the past 4 weeks shows that the trend is intact.
- A Small Pullback Bull Trend is a bull trend where the pullbacks are small. This one began with the pandemic crash. The biggest pullback was 10% and it came a year ago.
- A Small Pullback Bull Trend ends with a big pullback. That means a pullback that is at least 50% bigger than the biggest prior pullback. Here, the trend will remain intact until there is at least a 15% correction.
- Once it ends, the bull trend typically converts into a trading range. Initially, the odds are that it will be a bull flag. Traders should expect the trend to resume. If it does, it is usually a weaker bull trend.
- If the trading range lasts 20 or more bars, the probability of a reversal into a bear trend begins to get close to 50%.
- The bears want a higher high major trend reversal with the September high. However, the 5 strong bull bars after a 6-bar bear microchannel was a low probability event. A surprise typically has at least a small 2nd leg sideways to up.
- Therefore, the bears would need a surprisingly strong bear bar or a micro double top before traders would look for a reversal.
- For now, odds slightly favor sideways to up for November.
The Daily S&P500 Emini futures chart
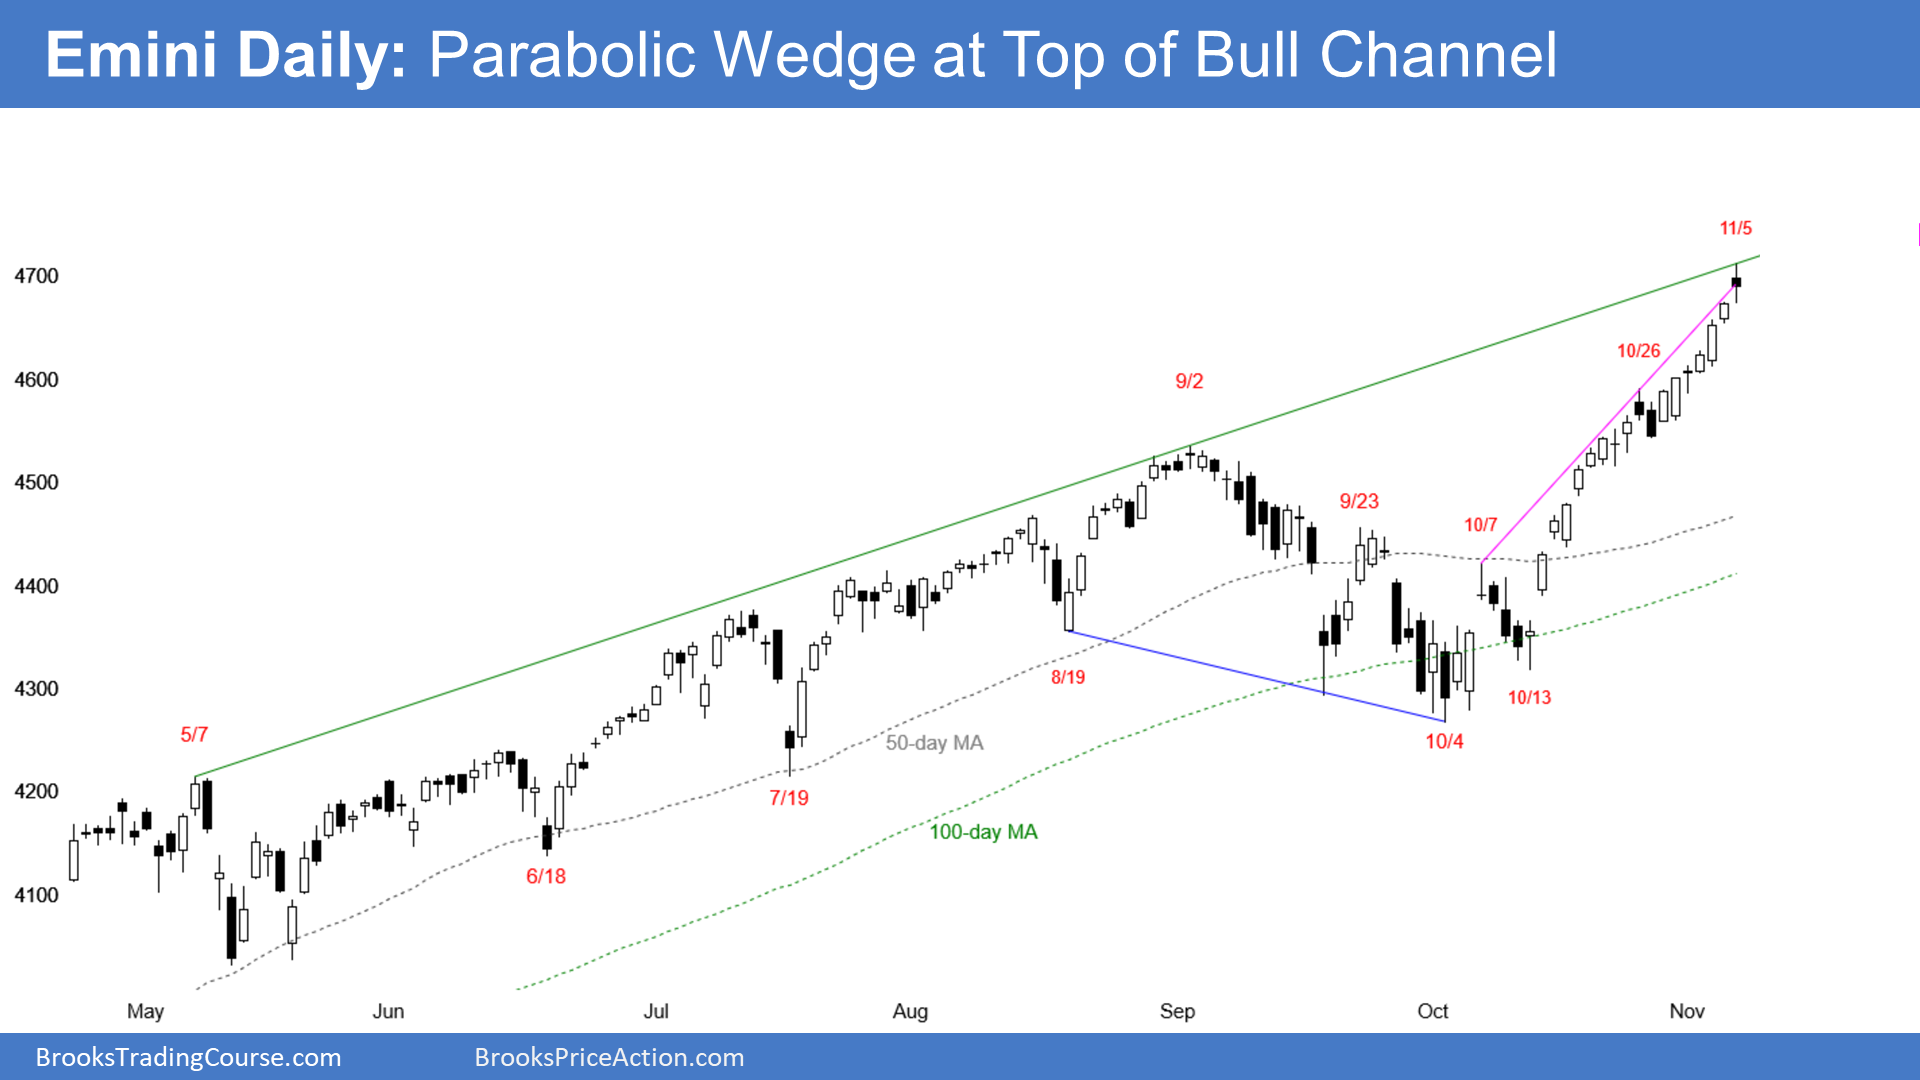
- The Emini continued to make new high every day this week. Friday was a bear doji but had a big tail below, so it is a weak sell signal bar.
- The dominant feature is a parabolic wedge buy climax at top of the bull channel.
- The bears want at least a 1- to 3-day pullback or a reversal down.
- It would also be from an expanding triangle. The final leg up in the triangle began on October 4. It has been very strong. That means most traders no longer see this as an expanding triangle.
- The bears will need at least a micro double top or a few consecutive bear bars closing near their lows before traders will think about a possible reversal down.
- The move up since October 13 is in a tight bull channel which means relentless bulls. Odds are bulls will buy the first 1- to 3-day pullback for a second leg sideways to up move.
- Al has said that there is a seasonal tendency to pull back in the 2nd week of November, but there is a strong tendency to rally from November 11 to December 5.
- However, seasonal tendencies are minor since it is very difficult to construct a profitable strategy using them.
- Traders looking for a big selloff in a bull trend during a seasonally bullish time need very strong bear bars before shorting. A seasonal tendency is not enough.
- The daily chart is overbought and in a resistance area so a big bear trend day can come at any time.
- The rally since October has been extreme. That increases the chance of several sideways to down days soon.
- With the Emini as overbought as it is, bulls will begin to take some profits soon. This will probably create a trading range lasting at least a couple of weeks starting within a few weeks.
- But unless the bears get several consecutive big bear bars closing near the lows, the odds continue to favor at least slightly higher prices. Trends usually successfully resist reversal attempts.
Trading Room
Traders can see the end of the day bar-by-bar price action report by signing up for free at BrooksPriceAction.com. I talk about the detailed Emini price action real-time throughout the day in the BrooksPriceAction.com trading room. We offer a 2 day free trial.
Weekly Reports Archive
You can access all weekly reports on the Market Analysis page.

