Trading Update: Tuesday October 3, 2023
S&P Emini pre-open market analysis
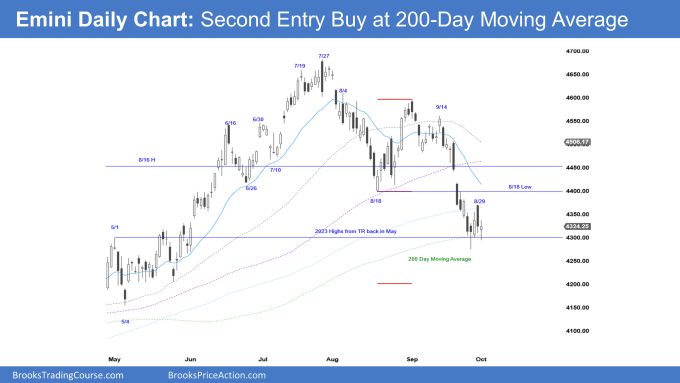
Emini daily chart

- The Emini found buyers below last Friday’s Low 1 short, forming a second entry buy a the 200 – Day Moving Average
- The bulls are hopeful that today will form an upside breakout and test the August 18th low.
- Next, the bulls will try to get a strong bull close beyond the August 18th low, increasing the odds of higher prices.
- The bears want the August 18th breakout point low to stay open, leading to a measuring gap. However, since the daily chart is in a trading range, the odds are against the gap staying open.
- The bulls are hopeful that the selloff from the July high is a large two-legged pullback and that a test of the July high will follow.
- The selloff is large enough that there are likely sellers somewhere above, making the argument of a bull trend unlikely.
- Since traders see the market as being in a trading range, trades will look to buy and scale in lower. The bears will look to sell two and three-legged rallies, scaling In higher.
- The channel down to the October low is tight, lowering the probability of a major reversal. Tight channels typically reverse into trading ranges and not opposite trends.
- The bulls will likely need a stronger trendline break than they have right now.
- The bulls must also overcome yesterday’s bad second entry buy signal bar. One way they can accomplish this is by forming a strong entry bar today.
- If the market gets a breakout above yesterday’s high, the bears will try and form a second entry sell.
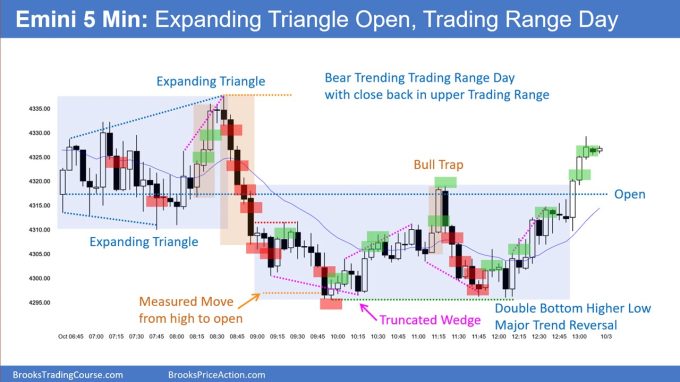
Emini 5-minute chart and what to expect today
- The Globex market pulled back and formed a small second leg up after yesterday’s late bull breakout during the U.S. session but then sold off 30+ points before day session open.
- The bulls will try to trigger the buy signal on the daily chart by going above yesterday’s high, and the bears are working to prevent this.
- As always, traders should expect the open to have a lot of trading range price action on the open.
- There is an 80% chance of a trading range open and only a 20% chance of a trend from the open. This means that most traders should be patient on the open and consider waiting for 6-12 bars before looking to enter.
- Most traders should try and catch the opening swing that will typically begin before the end of the second hour.
- It is common for the market to form a double top/ bottom or a wedge top/bottom before the open swing begins. This allows traders to try and enter on a stop entry, allowing for a strong risk/reward trade with decent probability.
- Traders should pay attention to the open of the day as well as yesterday’s high. The bulls will try their best to get a strong breakout and close above yesterday’s high, and the bears will try to prevent this.
- Lastly, being patient is the most important thing on the open. Most of the time, the open has a lot of trading range price action. This means that most days, a trader will not miss out on the opening swing if they wait 6-12 bars. By waiting, traders give up opportunities to trade for certainty of the day structure.
Yesterday’s Emini setups

Al created the SP500 Emini charts.
Here are several reasonable stop entry setups from yesterday. I show each buy entry with a green rectangle and each sell entry with a red rectangle. Buyers of both the Brooks Trading Course and Encyclopedia of Chart Patterns have access to a near 4-year library of more detailed explanations of swing trade setups (see Online Course/BTC Daily Setups). Encyclopedia members get current daily charts added to Encyclopedia.
My goal with these charts is to present an Always In perspective. If a trader was trying to be Always In or nearly Always In a position all day, and he was not currently in the market, these entries would be logical times for him to enter. These therefore are swing entries.
It is important to understand that most swing setups do not lead to swing trades. As soon as traders are disappointed, many exit. Those who exit prefer to get out with a small profit (scalp), but often have to exit with a small loss.
If the risk is too big for your account, you should wait for trades with less risk or trade an alternative market like the Micro Emini.
EURUSD Forex market trading strategies
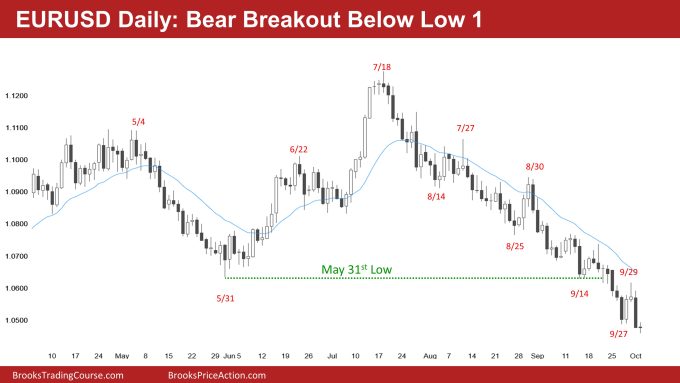
EURUSD Forex daily chart

- The Bears formed a bear breakout below the September 29th Low 1 short. The odds favored buyers below the Low 1, and now the bulls are trapped.
- The daily chart has been in a tight bear channel for some time. This increases the odds of a trading range forming soon.
- The odds favor buyers below the September 27th low and the market reaching the moving average.
- However, because yesterday’s selloff was a surprise, the bears may get a brief 2nd leg down before the bulls get their reversal up.
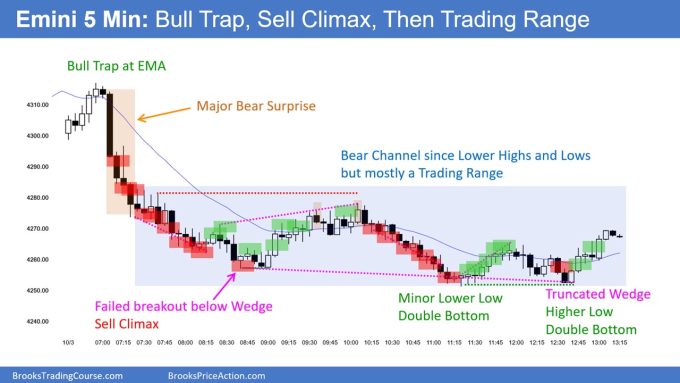
Summary of today’s S&P Emini price action

Al created the SP500 Emini charts.
End of day video review
End Of Day Review will be presented in the Trading Room today. See below for details on how to sign up.
See the weekly update for a discussion of the price action on the weekly chart and for what to expect going into next week.
Trading Room
Al Brooks and other presenters talk about the detailed Emini price action real-time each day in the BrooksPriceAction.com trading room days. We offer a 2 day free trial.
Charts use Pacific Time
When times are mentioned, it is USA Pacific Time. The Emini day session charts begin at 6:30 am PT and end at 1:15 pm PT which is 15 minutes after the NYSE closes. You can read background information on the market reports on the Market Update page.
S&P Emini Daily Chart. Hello! I’m the one that keeps commenting over the years about significant (double to triple digit point) data variation between trading platforms with the same chart filter setup Al uses. I filter my daily, weekly, and monthly charts for the S&P Emini like Al, that is, continuous contract, day (U.S.) session.
Today’s daily chart is the first occurrence of the daily chart that illustrates the June 1 and July 11 daily gaps. It still doesn’t show the June 9 gap that exists on my chart. I commented on the June 1 and June 9 gaps about 8 weeks ago when it appeared the June gaps were turning into magnets and was wondering why I could not see the gaps on the Trade Station daily or weekly charts.
None of the previous daily charts in the weekend reports illustrate the two June gaps and the one July gap. Except for today, I believe the daily charts are usually only posted in the weekend report. The last daily chart is in the September 24 report and the gaps don’t exist. If you go back endlessly through the reports, the daily June 1, June 9, and July 11 daily gaps; and the June 5 weekly gap bar are not illustrated on any chart. But the June 1 and July 11 gaps are illustrated in today’s S&P Emini daily chart? The June 9 daily and June 5 weekly gap bars are still not visible?
I would like to confirm, are the charts in the weekend report and the daily report both Trade Station charts? If the same, any explanation what changed between the daily chart in the September 24 report and the daily chart posted today? These gaps have been on my (thinkorswim) charts for over 3 months?
Thank you if you have time to clarify
PS – more batty stuff
My 150 SMA = 4309
My 200 SMA = 4234
Futures charts will never be consistent across platforms. Charts will vary depending on how the data feed is sampled. Charts will vary depending on how contract rollovers are handled. Charts will vary depending on which hours of the day are included. One of the ways to avoid these problems is to look at the cash index (SPX on most platforms) for longer term charts. Just remember the relationship of futures to cash changes with time, dividends and interest rates so sometimes one will make a significant new high or low while the other doesn’t.
Thank you for the explanation. I will just process the Trade Station charts in the daily and weekend reports with a grain of salt, recognizing charts for the same contract symbol tell a somewhat different story across different platforms.