Market Overview: S&P 500 Emini Futures
The S&P 500 Emini futures stalled around the Feb/March low and the bulls failed to get follow-through buying. The bears got the second leg sideways to down they were expecting. Odds favor at least slightly lower prices next week. As strong as the sell-off is, it could simply be a sell vacuum retest of the 5-week trading range low. If there is a breakout, odds slightly favor a downside breakout more.
S&P500 Emini futures
The Weekly S&P 500 Emini chart

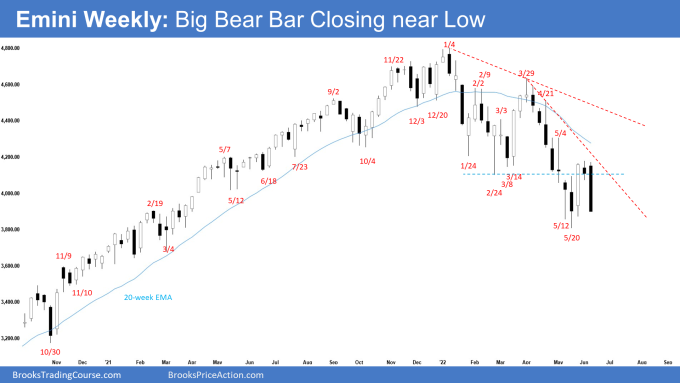
- This week’s Emini candlestick was a big bear bar closing near the low. It was a strong bear bar.
- Last week, we said the bears will try to trigger the low 1 sell signal bar by trading below the week’s low. Traders will have been monitoring whether this week closes as a bear bar near the low or reverses higher and close near the high with a long tail below.
- This week closed as a big bear bar near the low. The bears got follow-through selling following last week’s bear doji.
- We have said that the bears want the Emini to stall at a lower high around Feb/March lows or around the 20-week exponential moving average or the bear trend line.
- So far it stalled around the Feb/March lows and reversed lower.
- The sell-off since March was in a tight bear channel down. Odds are the pullback would be minor and traders expect at least a small second leg sideways to down move after a pullback because V-bottoms are not common. This week was the second leg sideways to down.
- The bears want a retest of the May low, and a breakout followed by a continuation of the measured move down to 3600.
- The bulls want a failed breakout below the 9-month trading range.
- They see a wedge bull flag (Jan 24, Feb 24, and May 20) with an embedded parabolic wedge (April 26, May 2, and May 20).
- They see this leg down as a retest of the low and want a reversal higher from a higher low major trend reversal and a double bottom with May 20 low.
- Since this week was a big bear bar closing near the low, it is a weak buy signal bar for next week. It is a good sell signal bar.
- It increases the odds of a gap down on Monday. However, small gaps often close early.
- The Emini has been in a trading range for the last 5 weeks. Traders may BL/SH (Buy Low, Sell High).
- As strong as the sell-off was this week, it could simply be a sell vacuum test of the 4-week trading range low.
- If there is a breakout, odds slightly favor a downside breakout.
- For now, odds slightly favor at least slightly lower prices next week.
- Bears want another bear bar which will increase the odds of another breakout attempt below the May low, while bulls want next week to close as a bull reversal bar even though next week may trade lower first.
The Daily S&P 500 Emini chart

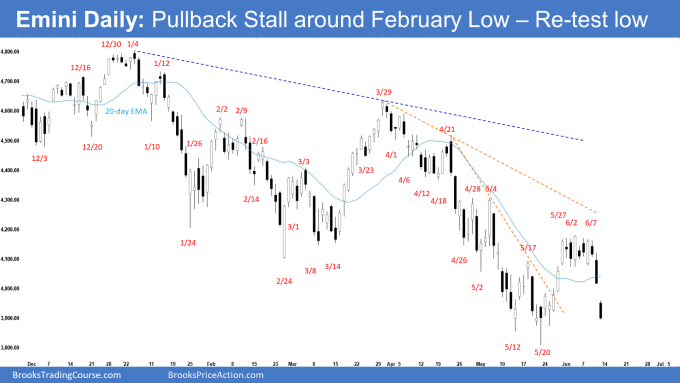
- The Emini remained in the tight trading range earlier in the week and broke out below on Thursday followed by a gap down on Friday. Friday closed as a bear bar near the low.
- We have said that the channel down from March 29 has been tight. Odds are, there should be at least a small second leg sideways to down after the pullback is over.
- If the bounce is more sideways and stalls around the 20-day exponential moving average or May 17 high or Feb/March low, bears will likely return to sell the double top bear flag.
- This week was the second leg sideways to down as sellers sold the micro double top bear flag (Jun 2 And Jun 7).
- The bulls hope that this sell-off is simply a sell vacuum test of the low.
- The bulls see a wedge bull flag (Jan 24, Feb 24, and May 20) with an embedded parabolic wedge (April 26, May 2, and May 20). They want a reversal higher from a higher low major trend reversal.
- Since Friday was a bear bar closing near the low, it is a weak buy signal bar for Monday.
- It may even gap down on Monday. Remember that small gaps usually close early.
- The bears want a retest of the low followed by a breakout and a continuation of the measured move down to around 3600 based on the height of the 9-month trading range.
- We have said there should be at least a small second leg sideways to down after the pullback is over. This week is the start of the second leg sideways to down.
- The bears will need to create consecutive bear bars closing near the low to increase the odds of a breakout below May low.
- If the Emini stalls around the May low and the bulls get a strong bull reversal bar or a micro double bottom, we may see bulls return for a double bottom major trend reversal higher.
Trading room
Traders can see the end of the day bar-by-bar price action report by signing up for free at BrooksPriceAction.com. Al talks about the detailed Emini price action real-time throughout the day in the BrooksPriceAction.com trading room. We offer a 2 day free trial.
Market analysis reports archive
You can access all weekend reports on the Market Analysis page.
What is the purpose to tell us “The Bears want” or “The Bulls want”. I know this is what Al says constantly on his reviews and in the Chat room. Of course the Bulls want the price to go up and vice versa. Maybe im the only who feels this way but it would have much more value to just say “the odds favor” and then give us the percentage. Like 60% chance the Market will go down from here, etc.
I find it quite helpful to know what the bulls and bears want so I can see if they are rewarded or disappointed by the subsequent price action.
To me, there’s a difference. A bull is someone who when they see the chart feels it’s better to buy than sell so they look to find a smart entry to buy. Conversely a bear sees the chart with the bias of selling. Al often talks about how there are reasonable entries for both biases. So instead of it just being a probability, when you think of bulls and bears, think of the bias you have when you see the bars and tip to one or the other side. Maybe that helps. Cheers.
It seems that several bars on the daily chart have prominent tails (5/12, 5/20, 5/22), in addition to a strong three-bar bull spike. Could this indicate a bottom, with bulls scaling in? And are the last two bear bars simply a vacuum test of this low?
Bulls who bought 4/28 and 5/4 scaled in around 5/20.
Then they got out around breakeven during the tight trading range 6/2.
We need more info to determine if the last two bars are a test. It is a sign the bulls gave up, if they didn’t get out around 6/2.