Trading Update: Wednesday March 30, 2022
Emini pre-open market analysis
Emini daily chart
- The current rally is very climactic, with only one bear bar in 11 bars, so the odds are we will see Emini sideways likely for a few days to relieve the exhausted bulls.
- The daily chart closed above the February high and 4,600 big round number.
- The rally from the March 14 low has been in a tight channel, so any reversal down is likely to be minor.
- The market is always in long, and there is probably around a 50% chance of a new all-time high. Everyone has the question of how deep the pullback will be before the market reaches or gets closer to the all-time high.
- The bulls hope to get a measured move of the February trading range. Any breakout above the all-time high will likely fail, and the market will likely continue sideways.
- The bears want a failed breakout of the February high. Next, they want a major trend reversal setup that tests back down to the February low.
- The bears know that the current rally is too strong to sell, so they will likely wait for a minor reversal before looking for a sell setup.
- Ultimately, the bears do not care if the market reaches the all-time high. If it does, the bears will want the market to go sideways and form a lower high or a higher high major trend reversal and selloff back down to the February low.
Emini 5-minute chart and what to expect today
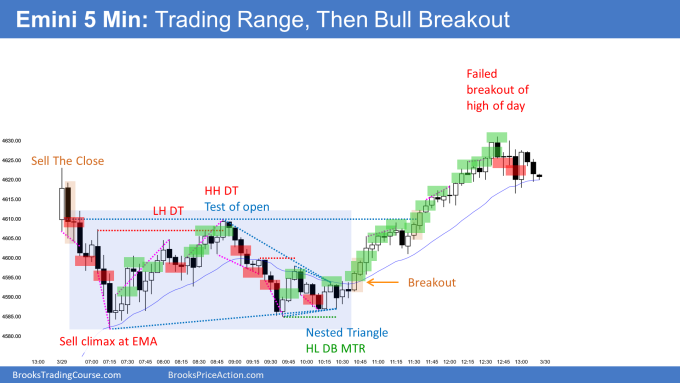
- The market is currently down 10 points in the Globex session.
- The daily chart has had four consecutive bull days, so the odds favor a bear close today.
- Traders should be open to a bear trend from the open and look to sell if there are consecutive big bear bars.
- Traders should pay attention to the open of the day. If today is primarily a trading range, the market will probably test the open of the day multiple times.
- If the market is not far above the open of the day late in the day, traders should look for a sell setup since the odds favor a close below the open.
- As always, if today is a trading range, traders should look to buy in the bottom 1/3 and sell in the top 1/3 or the range.
Yesterday’s Emini setups

Al created the SP500 Emini charts.
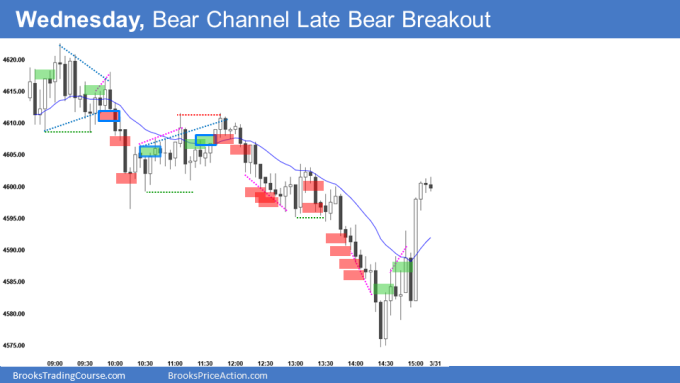
Here are several reasonable stop entry setups from yesterday. I show each buy entry with a green rectangle and each sell entry with a red rectangle. Buyers of both the Brooks Trading Course and Encyclopedia of Chart Patterns have access to a much more detailed explanation of the swing trades for each day (see Online Course/BTC Daily Setups).
My goal with these charts is to present an Always In perspective. If a trader was trying to be Always In or nearly Always In a position all day, and he was not currently in the market, these entries would be logical times for him to enter. These therefore are swing entries.
It is important to understand that most swing setups do not lead to swing trades. As soon as traders are disappointed, many exit. Those who exit prefer to get out with a small profit (scalp), but often have to exit with a small loss.
If the risk is too big for your account, you should wait for trades with less risk or trade an alternative market like the Micro Emini.
EURUSD Forex market trading strategies
EURUSD Forex daily chart

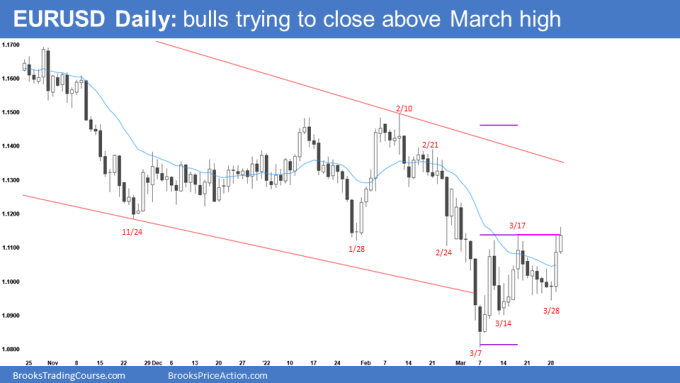
- The bulls got a bull breakout bar yesterday. However, it had a big tail on top, disappointing for the bulls.
- Yesterday was likely a strong enough surprise bar that the market will probably get a second leg up at a minimum.
- The bears are hopeful they can create a failed breakout of the March high and form a swing short that would set up a wedge top.
- The bulls still are hoping for the bull breakout of the March bear flag.
- While the odds favor the upside breakout, the bulls’ probability is not yet high.
- The bulls need today’s follow-through bar to close above the March high, which would increase the odds of the market going higher and possibly a measured move up.
Summary of today’s S&P Emini futures price action and what to expect tomorrow
- Al Brooks on London PA Symposium and overseas break.
- No Emini Daily Setups charts until Monday April 11, 2022.

End of day summary
- Note: The chart above is in central time zone. I was unable to adjust the chart to reflect pacific time.
- The Emini opened in a trading range for the first 18 bars, leading to a downside breakout.
- Since the market was in a trading range for the first 18 bars, the downside breakout has an increased risk of a trending trading range and more trading range price action, which is why the market continued sideways into the third hour of the day.
- The bears continued to channel down in a broad channel, which led to a downside breakout with less than 2 hours left in the day.
- Since the bear breakout late in the day was climactic, late in a broad bear channel, there was an increased risk of a rally into the close.
- Another thing to point out is that when you have a sell the close market that starts before 12:30 Pacific, it will usually fail to continue down into the close.
- Overall, the day was a trending trading range day, and when you have 2-3 breakouts that lead to trading ranges, the odds begin to favor one of the tradings ranges, becoming a magnet and acting as a final flag.
See the weekly update for a discussion of the price action on the weekly chart and for what to expect going into next week.
Trading Room
Traders can see the end of the day bar-by-bar price action report by signing up for free at BrooksPriceAction.com. I talk about the detailed S&P Emini futures price action real-time throughout the day in the BrooksPriceAction.com on trading room days. We offer a 2 day free trial.
Charts use Pacific Time
When I mention time, it is USA Pacific Time. The Emini day session charts begin at 6:30 am PT and end at 1:15 pm PT which is 15 minutes after the NYSE closes. You can read background information on the market reports on the Market Update page.
For “Another thing to point out is that when you have a sell the close market that starts before 12:30 Pacific, it will usually fail to continue down into the close”, do you mean that if a trend starts before 12:30 Pacific, it will usually fail to last until the close of the day? Thanks.
Yes, exactly. I meant to say 12:30 PM Pacific (2:30 PM Central) time.
Thanks Brad, and good luck Al on “the Old Continent”! If I could I would love to attend this extraordinary event; maybe another year?
The BO at bar 62 felt like a surprise (to me at least), considering the hesitation of the bears before it, and the many instances of reversals and dojis. In hindsight it is indeed a Broad Channel, but appeared like it only at the very end (and testing the low of yesterday). Q: Most probably this is covered somewhere in the course, but are there clues or pointers during the day that could in advance prognosticate this lower series of (overlapping) Trading Range, i.e. a Broad Channel? Thanks and all best!
This is the classic problem of trading ranges and broad channels. Both look and act almost the same, so that most traders will trade them the same.
Watch the videos on trading broad channels for a better understanding.
You have to remember that all trading ranges lead to trends; after the market is clearly broken out of a trading range, one can look back and see when the trend started. For example, yesterday’s bear trend started at around bar 7, but it was not clear in a bear trend until late in the day, and by that point, it was very late in the move.
Think about the market cycle; you have a trend that converts into a trading range. When in the trading range, the market fights over trend resumption and trend reversal. Eventually, one side wins, and there is a breakout. A successful breakout is when the market shifts from low probability to high probability. Before then, the market was close to 50%-50%, so it was hard to tell when the market would break out.
I hope this helps.
Thanks Brad, much appreciated. Obviously scalping is the best strategy on these kind of days