Trading Update: Friday June 23, 2023
S&P Emini pre-open market analysis
Emini daily chart
- The Emini reversed up from 4,400 and the June 15th low. This price level was likely to act as support.
- The context is bad for the bulls and there are probably sellers above.
- The bears have a four-bear microchannel down to the June 15th low. This increases the odds of sellers above. At the time of writing this, the Globex market is testing the low of yesterday’s bar.
- While the context is not great for the bulls buying above yesterday’s high, it is also weak for the bears. The market is likely forming a trading range, and buyers are probably not far below.
- Although the June 15th bull breakout was climactic, it was a reasonable buy if a trader used a wide stop and scaled in lower. This increases the probability that the market will return to the June 15th close and allow the trapped bulls out.
- The market is in a trading range on high time frames such as the weekly chart. This means traders should expect the bulls to become disappointed over the next several months. This increases the probability that the daily chart will go sideways in a trading range.
- There is a saying on Wall Street: “Sell in May and Go Away,” This is because the overall S&P 500 and Nasdaq historically have had weaker returns compared to November to April. This is in line with the likely trading range price action that will happen on the daily chart.
- Just because historically, stocks have sold off from May through October does not mean traders should ignore price action. Price action should be a trader’s source of truth when making market decisions.
Emini 5-minute chart and what to expect today
- Emini is down 30 points in the overnight Globex session.
- The 60-minute Globex chart has been in a bear channel for several days. The buying pressure is beginning to increase, increasing the odds that the market will go above a major lower high soon, such as yesterday’s Globex session high at 4,427.
- The market is below yesterday’s low, and probably more buyers are below.
- If the U.S. Session opens around yesterday’s low, traders should be prepared for a possible early day’s low.
- Traders should be prepared for a trading range open and limit order trading. This means that most traders should consider not trading during the first 6-12 bars unless they are comfortable with limit order trading.
- Most traders should try and catch the opening swing that often begins before the end of the second hour. It is common for the opening swing to start after forming a double top/bottom or a wedge top/bottom. This means a trader can often wait for one of the patterns, as mentioned earlier, to develop before placing a swing trade.
- Lastly, today is Friday, so weekly support and resistance are important. Traders should pay attention to Yesterday’s low and today’s open. The bears want the weekly chart to close on its low. This means that they will try and create a bear trend today. Traders should be prepared for a surprise breakout up or down late in the day as traders decide to close the weekly chart.
Yesterday’s Emini setups

Al created the SP500 Emini charts.
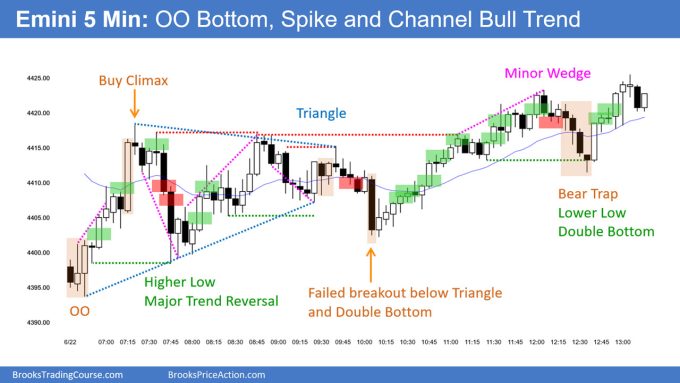
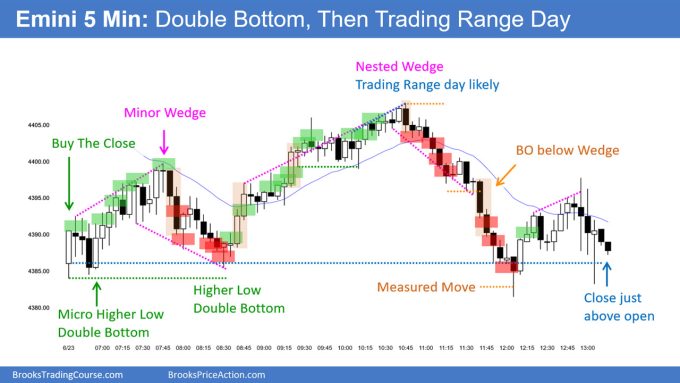
Here are several reasonable stop entry setups from yesterday. I show each buy entry with a green rectangle and each sell entry with a red rectangle. Buyers of both the Brooks Trading Course and Encyclopedia of Chart Patterns have access to a near 4-year library of more detailed explanations of swing trade setups (see Online Course/BTC Daily Setups). Encyclopedia members get current daily charts added to Encyclopedia.
My goal with these charts is to present an Always In perspective. If a trader was trying to be Always In or nearly Always In a position all day, and he was not currently in the market, these entries would be logical times for him to enter. These therefore are swing entries.
It is important to understand that most swing setups do not lead to swing trades. As soon as traders are disappointed, many exit. Those who exit prefer to get out with a small profit (scalp), but often have to exit with a small loss.
If the risk is too big for your account, you should wait for trades with less risk or trade an alternative market like the Micro Emini.
EURUSD Forex market trading strategies
EURUSD Forex daily chart

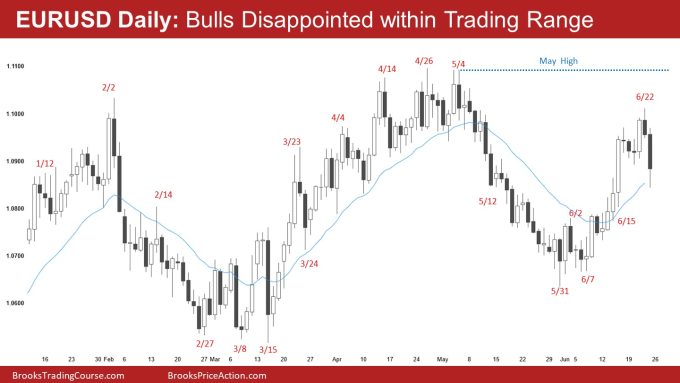
- The EURUSD had a downside bear breakout yesterday, reminding traders that the daily chart is in a trading range.
- The Bears who sold the June 15th bull breakout above to make money by scaling in higher. This signifies trading range price action and increases the odds of sideways trading.
- Yesterday’s bear breakout is strong enough to increase the odds of a 2nd leg down. This means sellers are probably above today’s close, assuming it is a bull bar.
- Since the rally up from the June low is strong, the downside is probably limited. This is due to bulls buying below and bears selling above, both scaling in. This causes trading range price action.
- Overall, yesterday’s bear breakout bar is probably strong enough to give the bears brief control for the next couple of days and increase the odds that the bears get at least a small 2nd leg down.
Summary of today’s S&P Emini price action

Al created the SP500 Emini charts.
End of day video review
Today’s End Of Day review will be presented in the Trading Room and only available to the trading room subscribers.
See the weekly update for a discussion of the price action on the weekly chart and for what to expect going into next week.
Trading Room
Al Brooks and other presenters talk about the detailed Emini price action real-time each day in the BrooksPriceAction.com trading room days. We offer a 2 day free trial.
Charts use Pacific Time
When times are mentioned, it is USA Pacific Time. The Emini day session charts begin at 6:30 am PT and end at 1:15 pm PT which is 15 minutes after the NYSE closes. You can read background information on the market reports on the Market Update page.
Regarding Emini on June 23rd, why is the setup at bar 24 not considered a HL MTR?
For EURUSD, does an expanding triangle pattern apply to the daily chart going back to June 15 high?
Hi Shane,
yes, it is fair to say that it is an expanding triangle.