Market Overview: S&P 500 Emini Futures
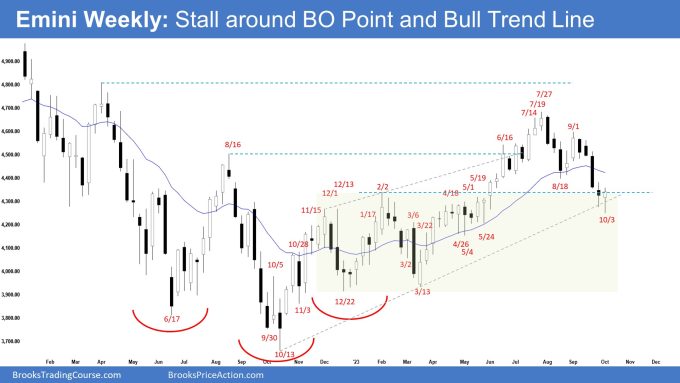
The weekly chart formed an Emini test breakout point; a two-legged pullback testing the February 2 high (breakout point) and the bull trend line. The bulls see the current move down simply as a 50% pullback (of the move which started in March) within a broad bull channel. If the market trades higher, the bears want another leg down to complete the wedge pattern with the first 2 legs being August 18 and October 3.
S&P500 Emini futures
The Weekly S&P 500 Emini chart

- This week’s Emini candlestick was a bull reversal bar closing in the upper half with a long tail below.
- Last week, we said that while the Emini could still trade a little lower, odds slightly favor the market to still be Always In Long.
- This week traded below last week’s low but reversed into a bull reversal bar.
- Previously, the bulls got a strong trend up (from March) in a tight bull channel.
- The bulls want the Emini to reverse back above the 20-week exponential moving average.
- They hope to get a retest of the July 27 high from a double-bottom bull flag (Aug 18 and Oct 3).
- They see the current move down simply as a 50% pullback (of the move which started in March) within a broad bull channel.
- Next week, the bulls will need to create follow-through buying to increase the odds of a retest of July 27 high.
- The bears got a two-legged pullback testing the breakout point (Feb 2) and the bull trend line.
- They want a strong breakout below the bull trend line with follow-through selling.
- If there is a pullback (bounce), they want another leg down to complete the wedge pattern with the first 2 legs being August 18 and October 3.
- Since this week was a bull bar closing near its high with a long tail below, it is a buy signal bar for next week.
- Odds slightly favor the market to trade at least a little higher.
- Traders will see if the bulls can get a strong follow-through bull bar or will next week trade slightly higher, but close with a long tail above or a bear bar.
- For now, odds slightly favor the market to still be Always In Long (bull trend remains intact; higher highs, higher lows).
- The pullback has also fulfilled the minimum requirement of TBTL (Ten Bars, Two Legs).
The Daily S&P 500 Emini chart

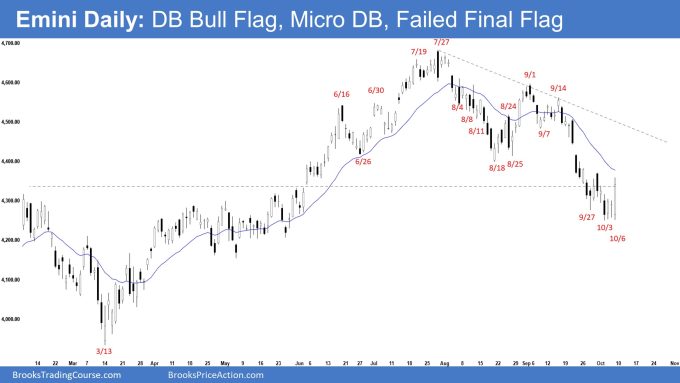
- The market traded slightly lower early in the week followed by a sideways trading range forming an ii (inside inside pattern on Wednesday and Thursday. Friday broke below the ii pattern but reversed to break above it, closing as a big outside bull bar.
- Previously, we said that the market may still be in the sideways-to-down pullback phase. Traders will see if the bears can create follow-through selling or will the market trade slightly lower but find buyers around the February 2 high area.
- So far, the market is stalling around the February 2 high area.
- The bears got a second leg sideways to down from a lower high major trend reversal and a double top bear flag (Sept 1 and Sept 14).
- They got a 50% pullback of the move which started in March, testing the February 2 high which was the breakout point of the rally.
- If the market trades higher from here, they want another leg down completing the wedge pattern with the first two legs being August 18 and October 3.
- The bulls want a reversal up from a double bottom bull flag (Aug 18 and Oct 3), a micro double bottom (Oct 3 and Oct 6) and a failed final flag (Oct 6) followed by a retest of the July 27 high and a strong breakout above.
- They see the current move simply as a 50% pullback and a test of the breakout point (Feb 2) of the rally.
- The next targets for the bulls are the bear trend line and the September high.
- Since Friday was a big outside bull bar closing in its upper half, it is a buy signal bar for Monday.
- Odds slightly favor the Emini to trade at least a little higher.
- Traders will see if the bulls can create consecutive bull bars closing near their highs. If they get that, the odds of a retest of the September high increase.
- Or will the market trade slightly higher but is weak and sideways (overlapping bars, doji(s), bear bars)? If it is weak, the odds of a retest of the current leg low (Oct 3) increase.
- For now, while the market may still trade sideways to down for a few more weeks, the bull trend remains intact.
Trading room
Al Brooks and other presenters talk about the detailed Emini price action real-time each day in the BrooksPriceAction.com trading room. We offer a 2 day free trial.
Market analysis reports archive
You can access all weekend reports on the Market Analysis page.
Two legs down into the April/May TR. A logical place for the bulls to test the waters. If they can’t get follow through after Friday’s surprise bar then they are in serious trouble.
Dear Andrew,
Yeah.. agreed.. in terms of time, the PB has also lasted about half of the rally.. seems about the right time to attempt a pullback..
A third leg down could still be in the cards.. thereby forming a wedge bull flag, or a MTR, or a double bottom after a brief pullback (bounce).
Have a blessed week ahead..
Best Regards,
Andrew