Market Overview: S&P 500 Emini Futures
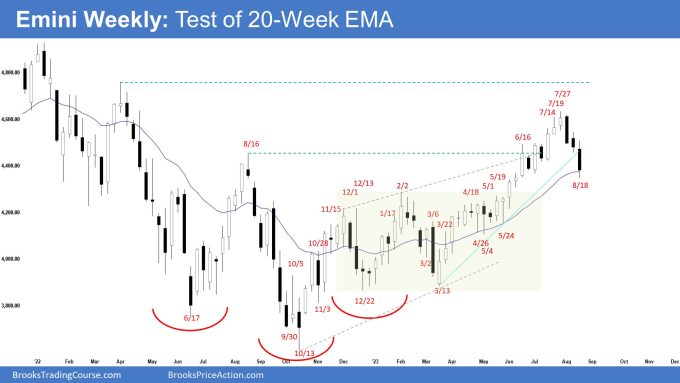
The bears created an Emini test of the 20-week EMA on the weekly chart. They need to create follow-through selling trading far below the 20-week EMA to increase the odds of a reversal down. The bulls see the move down as a minor pullback and want at least a small retest of the July 27 high.
S&P500 Emini futures
The Weekly S&P 500 Emini chart

- This week’s Emini candlestick was another consecutive bear bar closing in its lower half with a prominent tail below.
- Last week, we said that the odds continue to slightly favor the market to still be in the sideways to down pullback phase.
- The bears got a reversal down from a wedge pattern (Dec 13, Feb 2, and Jul 27) and a micro wedge (Jul 14, Jul 19, and Jul 27).
- They want a larger pullback from a climactic move.
- A reasonable target for the bears is the 20-week exponential moving average and they got it this week.
- They will need to continue creating consecutive strong bear bars trading far below the 20-week exponential moving average (EMA) to convince traders that a reversal down could be underway.
- The bulls got a strong leg up (since March) in a tight bull channel.
- They want a measured move using the height of the 6-month trading range which will take them to the March 2022 high area.
- The move up had lasted a long time (4 months) and was climactic.
- The market needed to trade sideways to down to work off the overbought condition. The minor pullback has begun.
- The bulls want any pullback to be shallow and weak (with overlapping bars, doji(s) and bull bars) and for the 20-week EMA to act as support.
- For now, odds are the pullback would likely be minor to be followed by at least a small retest of the prior leg high (Jul 27).
- Since this week’s candlestick was a bear bar closing in the lower half, it is a sell signal bar for next week.
- The odds slightly favor at least a small second leg sideways to down after a small pullback.
- Traders will see if the bears can continue to create consecutive bear bars or will the pullback stall sideways around the 20-week EMA.
- If next week is a surprise bull bar about equal in size to this week’s candlestick closing near its high, it could lead to a retest of the July 27 high.
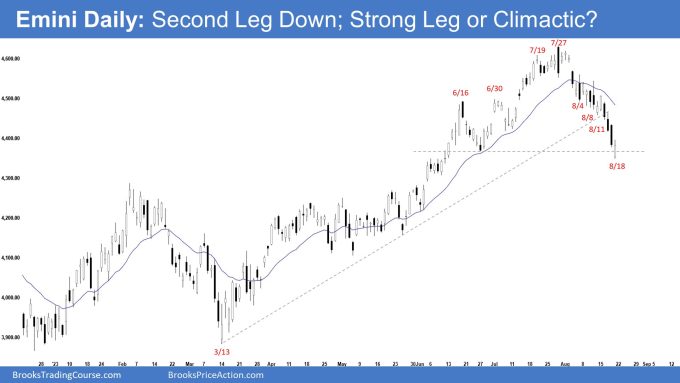
The Daily S&P 500 Emini chart

- The Emini traded lower for the week. Friday gapped lower but reversed to close as a bull bar near in its upper half.
- Last week, we said that odds slightly favor the market to still be in the sideways to down pullback phase.
- The bears manage to create another leg down this week. The move down is in a tight bear channel.
- They got a reversal from a climactic move, a wedge pattern (Dec 13, Feb 2, and Jul 27), and a small wedge (Jun 30, Jun 19, and July 27).
- A pullback would usually last at least TBTL (Ten Bars, Two Legs). So far, the minimum requirement has been fulfilled.
- They will need to continue creating strong bear bars closing near their lows, trading far below the bull trendline to increase the odds of a reversal down.
- If there is a pullback (bounce), they want at least a small second leg sideways to down.
- The bulls want a measured move up using the height of the 6-month trading range which will take them near the March 2022 high.
- The move up since March 13 low is in a tight bull channel which means strong bulls.
- However, it also lasted a long time and was climactic. A minor pullback has begun.
- The bulls want a retest of the July 27 high followed by a breakout above and a continuation of the bull trend.
- Since Friday was a bull bar closing in the upper half, it is a buy signal bar for Monday.
- The move down is slightly climactic. The market may trade slightly higher early next week.
- However, it is following a 5-bar bear microchannel. It may not be a strong buy setup.
- Because of the tight bear channel down, odds slightly favor at least a small second leg sideways to down after a pullback (bounce).
- Overall, odds slightly favor the current sideways to down pullback to be minor and at least a small retest of the prior trend high (Jul 27) after the pullback phase.
- For now, traders will see if the bears can create another leg down after a pullback or will the bulls start creating strong consecutive bull bars instead.
- If the bulls manage to create consecutive bull bars closing near their highs instead, it could lead to a retest of the July 27 high.
Trading room
Al Brooks and other presenters talk about the detailed Emini price action real-time each day in the BrooksPriceAction.com trading room. We offer a 2 day free trial.
Market analysis reports archive
You can access all weekend reports on the Market Analysis page.
Thx Andrew for the great report! Really appreciate seeing the weekly review!
Ola Mario..
You’re most welcome.. thanks for going through the report..
Wishing a blessed week ahead to you..
Best Regards,
Andrew
Andrew hey, Thanks for great report. Thinking loudly how likely bulls are trying to create DB Bull flag with June 26th low that was a major HL up to July 27th high? If Friday bull reverse is a DBBF with June 26th low it is a potential MM to the ATH area with the July 27th high as a neckline. Thoughts?
Dear Eli, thanks for going through the report..
Yes, bulls will try to create a reversal from the 26th June double bottom bull flag..
In a very strong trend, a pullback can very strong such as this one, but the reversal up from the double bottom bull flag can be equally abrupt, perhaps after a small second leg sideways to down (sometimes only a single bar) on the daily chart.
Let’s see how the market plays out this week for more clues..
Thanks for your continuous support..
Best Regards,
Andrew
Thank you Andrew for these blog posts
, one of my favorite time of the week; reading your weekend analysis of the ES and CL as I get ready for the BPA Traderoom. – Rose
Dear Rose,
Thank you very much for your encouragement..
Keep up the great work in the BPA Traderoom. I’ve seen a couple of your videos on youtube and love them..
Take care and wishing a blessed week ahead to you..
Best Regards,
Andrew