Trading Update: Wednesday September 27, 2023
S&P Emini pre-open market analysis
Emini daily chart
- The Emini sold off yesterday, testing near the 200–day moving average and the 4,300 big round number.
- Both of the prices mentioned above levels will probably act as support and limit the downside over the next couple of days.
- The selloff on the daily chart is climactic, and the odds favor a pullback lasting a couple of bars over the next few days.
- Right now the daily chart is forming a follow-through bar closing near its low. Since today is Wednesday, the halfway point in the week, traders should be open to the possibility of a reversal up and a test of the open of the week.
- The bulls still expect a test of the August 18th low to allow the trapped bulls who bought this low and scaled in lower.
- The bears want the August 18th low to become a successful measuring gap leading to a measured move down from the September 1st high to the August 18th low.
- While the bears may get their measured move down, more likely the market will reach the August 18th low, before the bear gets their measured move down.
Emini 5-minute chart and what to expect today
- Emini is up 15 points in the overnight Globex session.
- The 60-minute Globex chart has been in a tight bull channel since yesterday’s close. The bulls are hopeful that the overnight/morning rally is the first leg and the U.S. session will form a second leg and test of yesterday’s high.
- The odds favor today closing above today’s open and forming a bull bar on the daily chart.
- There is an 80% chance of a trading range open and only a 20% chance of a trend from the open. This means that most traders will be better off expecting a trading range on the open and being more cautious.
- It is common to get surprise breakouts on the open that trap traders into entering a breakout with a lower probability of success than one thing.
- Generally, everything is closer to 50% on the open. This means lower probability events have a greater risk of happening, and higher probability events have a slightly lower probability.
- This means that most traders should try and catch the opening swing that often begins after the formation of a double top/bottom or a wedge bottom/top.
- Waiting for one of the stops mentioned above entries to form often provides traders with a great risk/reward trade.
Yesterday’s Emini setups

Al created the SP500 Emini charts.
Here are several reasonable stop entry setups from yesterday. I show each buy entry with a green rectangle and each sell entry with a red rectangle. Buyers of both the Brooks Trading Course and Encyclopedia of Chart Patterns have access to a near 4-year library of more detailed explanations of swing trade setups (see Online Course/BTC Daily Setups). Encyclopedia members get current daily charts added to Encyclopedia.
My goal with these charts is to present an Always In perspective. If a trader was trying to be Always In or nearly Always In a position all day, and he was not currently in the market, these entries would be logical times for him to enter. These therefore are swing entries.
It is important to understand that most swing setups do not lead to swing trades. As soon as traders are disappointed, many exit. Those who exit prefer to get out with a small profit (scalp), but often have to exit with a small loss.
If the risk is too big for your account, you should wait for trades with less risk or trade an alternative market like the Micro Emini.
EURUSD Forex market trading strategies
EURUSD Forex daily chart

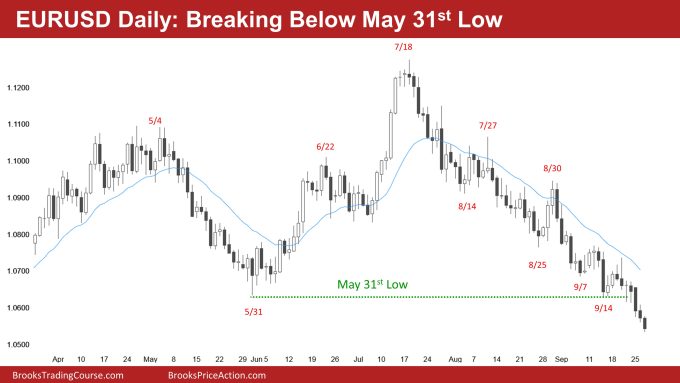
- The EURUSD closed below the May 31st low and formed a follow-through bar yesterday.
- At the moment, today is another strong bear breakout bar. However, the bears will have to prevent any strong buying pressure for the entire U.S. session if today is going to close on its low.
- More likely, the bears will get disappointed with today’s breakout bar.
- Because the daily chart is always in short and in a tight bear channel, traders will sell, taking a chance that the market goes lower. However, those bears will likely be quick to exit if the bulls get a reversal today.
- More likely, the bears will become disappointed over the next few days, and the market will go sideways. The bulls still expect the market to reach the moving average.
Summary of today’s S&P Emini price action

Al created the SP500 Emini charts.
End of day video review
Here is YouTube link if video popup blocked:
Emini End of Day Review – Wednesday September 27, 2023 – Brad Wolff
See the weekly update for a discussion of the price action on the weekly chart and for what to expect going into next week.
Trading Room
Al Brooks and other presenters talk about the detailed Emini price action real-time each day in the BrooksPriceAction.com trading room days. We offer a 2 day free trial.
Charts use Pacific Time
When times are mentioned, it is USA Pacific Time. The Emini day session charts begin at 6:30 am PT and end at 1:15 pm PT which is 15 minutes after the NYSE closes. You can read background information on the market reports on the Market Update page.
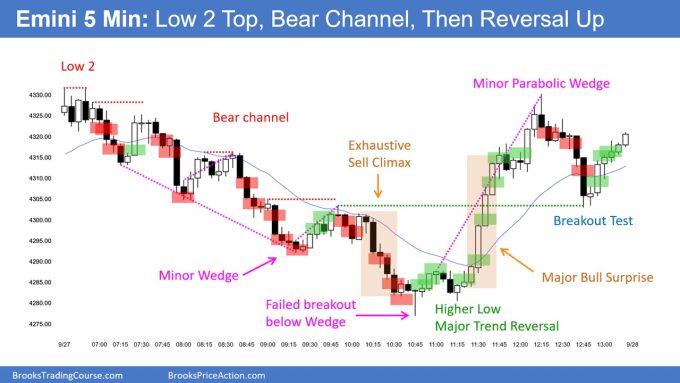
Regarding the HL MTR late in day. I wonder where this broke the bearchannel which were present all day. I thought this was an important part of a MTR.
(I saw the higher low, but was not convinced as no trendline break. (I will watch video now, so I dont know if it was mentioned there. I just seem to remember from course the break of trendline was extremly important to get a MAJOR reversal and not just a minor (very common to let time pass to be able to break trendline).
Awhile since I watched course, but remember this helped me to be more patience to enter for a MTR setup.
“Not curious when I know everything ”
Per Erik
The break happened on the other side of the channel. Bar 51 broke through the low side of the channel trying to accelerate the move down. Notice the classic reversal clue on the same bar that the move down was probably over.
I am not 100% sure, but I think one of the criterias for a MTR is a break of the BEAR trendline (or bull) as in the one on the upside of the beartrend.
I guess anyway that there is always exeption regard to rules and the break of trendline “rule” will probably not work that well regards to V reversals or atleast the HL will often be pretty far away from the start of the BO. Ji
(Basicly just “nitpicking” (right word?) regard to a video in course where I am pretty sure Al makes a pretty solid case that the Bear/bull trendline must be broken for it to be a major trend reversal. But obviously as said, no rule without any exceptions. (
Dear Brad,
Thx for the market analysis! I wonder if you refer to the 150-day moving average which is near the 4,300 level. When you mentioned:
“200-day moving average and the 4,300 big round number.”
I see the 200-day moving average much lower, around the 4,220 level…
I am using a 200-Day Simple Moving average on the September RTH chart, which is around 4,300. I would be interested to see your chart if yours differs that much.
Monthly 20EMA is also around 4300 BRN
Oh cool. It appears you may be in the same parallel Emini data universe as me. I’m on the thinkorswim (TOS) platform. My 150 and 200 SMA on the daily chart match your numbers. I didn’t want to clobber the comment section here with more information. If interested, I sent you more data analysis for comparison in a Forum post Topic Title, “S&P Emini 9/27 Report: Extended Comments – Trading In Parallel Universes”