Market Overview: Weekend Market Update
The Emini, like all financial markets, is waiting for Wednesday’s FOMC announcement. While the June rally has been strong, it still has not yet broken above the May all-time high. Wednesday’s report could lead to a breakout or a reversal down.
The crude oil futures market sold off strongly for 2 months. However, that selloff is probably only a bear leg in developing trading range between $50 and $60. It should begin a rally up to 60 within the next 2 weeks.
The EURUSD daily Forex chart is still on a consecutive outside bar buy signal. Even though it sold off this week, traders should expect at least a small 2nd leg up beginning within 2 weeks.
Crude oil Futures market:
Sell climax should reverse up soon from around $50
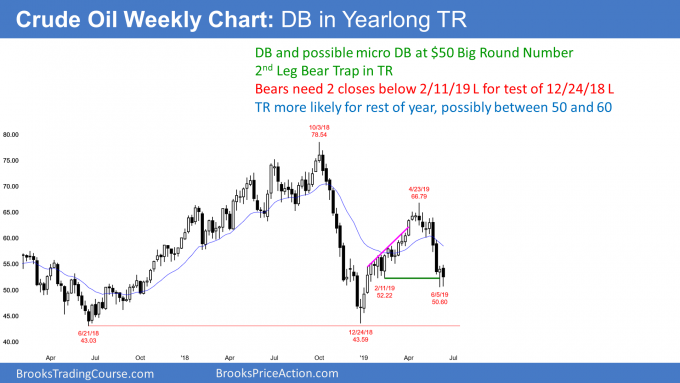
The crude oil futures market triggered a minor buy signal on the weekly this week by going above last week’s high. Last week was a bull doji reversal bar after a 2 week sell climax. The selloff was in a 3 year trading range and it tested the support of the January low.
In addition, it was the 2nd leg down from the April high. A strong 2nd leg down in a trading range is often a 2nd Leg Bear Trap. It can be simply a sell vacuum test of support that reverses back up.
If so, it traps bears into a bad short. They are assuming that the selloff is a breakout and will have at least one more leg down. But under the current circumstances, a 2nd Leg Bear Trap is more likely.
There might be a 2 – 3 week new low to below $50, but the odds favor a rally back up to the top of the most recent sell climax over the next 1 – 2 months. That is the May 30 high just below $60.
I have been saying since October that the huge selloff might test the June 2017 low, but then lead to a trading range that could last a year. That is still what is most likely.
Traders are now deciding if this past week will form a micro double bottom with the prior week and then rally to $60. The other option is another week or two of selling and then begin a month-long rally to around $60. Less likely is a continued selloff back to the December low of 43.59
EURUSD weekly Forex chart:
Possible failed oo buy signal on daily chart
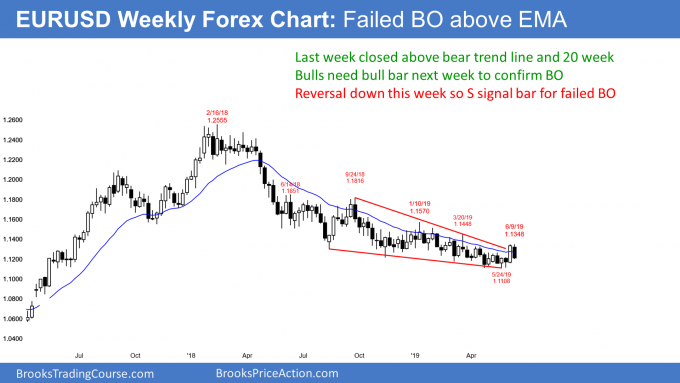
The weekly chart has been in a tight bear channel for a year. Every move up and down reversed within a few weeks. However, two weeks ago was the 1st time since September that the bulls got a close above the 20 week EMA. They also got a close above the bear trend line. But traders want to see consecutive closes above resistance before they believe a breakout will succeed.
The bulls were disappointed by the the strong reversal down this week. They wanted a 2nd big bull trend bar closing on its high. The probability now favors a failed breakout and a test of the May low.
The bulls, however, still have hope. Wednesday’s FOMC report has the potential to create big moves in all financial markets. If the bulls are lucky, they will get a surprisingly big rally after Wednesday’s report. Sometimes follow-through buying after a breakout comes a week or two later. They are hoping that will be the case this time.
Weak sell signal on the weekly chart
Since this week was a bear bar closing near its low, it is a sell signal bar for next week. The bears see the 3 week rally as just another bear rally in the yearlong bear channel. This past week’s bear body represents a failed breakout and the start of a reversal back down to below the May low.
The bears need a strong entry bar this coming week. If instead this coming week reverses back up, then the probability will again shift in favor of a successful breakout above the bear channel.
Daily chart pulling back from oo buy signal
The EURUSD daily Forex chart formed a consecutive outside bar buy signal (oo buy signal) 2 weeks ago. I have been saying for the past week that there might be a test back down to the June 6 low. That is about a 50% pullback and a test of the April 2 higher low as well.
Friday’s selloff could be that test. However, after 3 bear days, the bulls need to stop the selling. They then need a reversal back up from a higher low. If they get their reversal up within the next 2 weeks, there will be a head and shoulders bottom on the daily chart. The left shoulder is the April 2 higher low and the head is the April 26/May 23 double bottom.
The bears are hoping that the 3 day selloff is a resumption of the yearlong bear trend. However, they need a close below the May low. Without that, the bulls will buy and try to create a higher low major trend reversal up (here, also a head and shoulders bottom).
Traders expect all financial markets to be in limbo ahead of next Wednesday’s FOMC announcement. The uncertainty is greater than usual, which increases the chance of a big move up or down after the report.
Monthly S&P500 Emini futures chart:
Strong reversal up from below May’s outside down bar
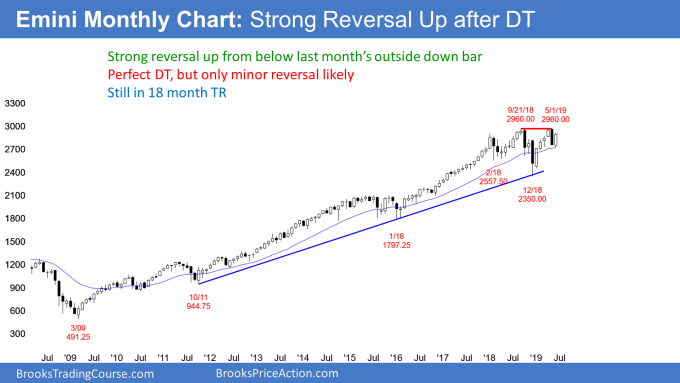
The monthly S&P500 Emini futures chart had an outside down bar in May. There is also a double top with the May and September highs. Therefore May was a sell signal bar. When June traded below the May low, it triggered the monthly sell signal. However, the Emini immediately reversed up strongly.
June so far is a big bull trend bar and it has reversed much of the May selloff. If June breaks above the May high, it will be a 2nd consecutive outside bar. When an outside up bar follows an outside down bar, it is a reliable buy signal bar for the next month.
There is plenty of time remaining in June to accomplish this. Next Wednesday’s FOMC announcement is especially important because there is more uncertainty than usual about what the Fed will do. This means the report is a potential catalyst for a surprisingly big move up or down.
For example, a strong rally could break above the May high. That would create consecutive outside bars and make a new all-time high likely within a month.
Alternatively, the report could lead to a reversal back down to below the May low. If so, the Emini will probably be sideways to down for another month or two.
Weekly S&P500 Emini futures chart:
Perfect doji is weak follow-through after big outside up bar
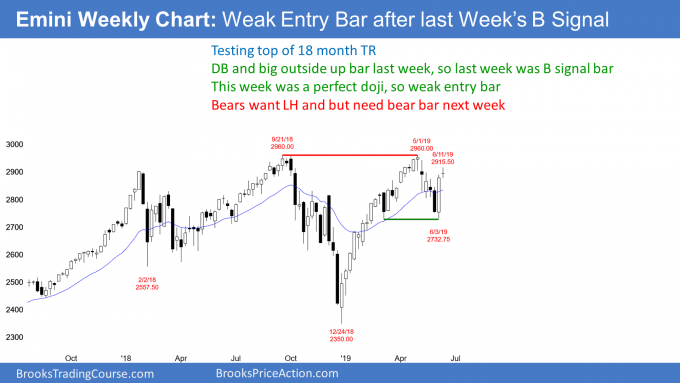
The weekly S&P500 Emini futures chart had a big outside up bar 2 weeks ago. While that is a buy signal bar in a bull trend, I wrote last week that there were problems with the setup. When a buy signal bar is especially big, the stop is far below. That increased risk makes many bulls wait for a pullback to buy.
Furthermore, the top of the bar is just below the resistance of the September/May double top. That reduces the probability of a big move up.
This increased risk and reduced probability reduced the number of bulls willing to buy above the high of the buy signal bar. The result was that this week was small and it closed exactly at the open. Last week was a perfect doji candlestick pattern, which is neutral. Traders see it as a weak entry bar. Consequently, it increases the chance that the buy signal will fail and the Emini will trade back down.
This week closed at its open in the middle of the week’s range. Traders do not see it as a compelling sell signal bar for next week. There will probably be buyers than sellers below its low. Any reversal down will probably only be a 1 – 2 week pullback rather than than a trend reversal.
Technical factors usually are more important to traders
Fundamentals control what a market will do over the next many months. But technical factors are usually more important than the fundamentals for traders, who look for short-term moves.
This upcoming week is different. Because of the high degree of uncertainty about next Wednesday’s FOMC meeting, there is a greater potential for a surprisingly big move up or down. It could briefly overwhelm the technical considerations.
Technical traders will evaluate the price action after the report to formulate opinions about what will follow. The choices are a new all-time high, a reversal down, or sideways trading for at least a couple weeks.
Sideways is always more likely, especially since the Emini has been in a trading range for 18 months. However, there is an increased potential of a big move up or down.
Daily S&P500 Emini futures chart:
Strong rally again testing all-time high ahead of FOMC
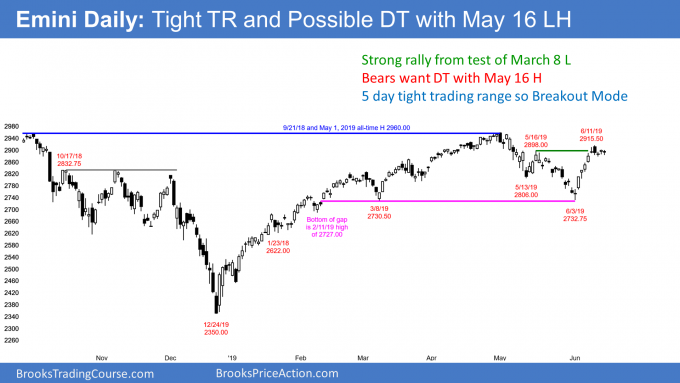
The daily S&P500 Emini futures chart traded sideways in a tight range this week. While it broke above the May 16 major lower high, it stalled. The bears formed a micro double top this week in addition to a potential double top with that May high. They hope for a reversal down below the June 3 neckline and then a 150+ point measured move down. However, they need a strong sell signal bar or a strong reversal down before traders will conclude that the June rally is failing.
The bulls had an exceptionally strong rally in early June. They hope that the momentum is enough for the rally to continue up to a new all-time high.
Wednesday’s FOMC announcement is a potentially strong catalyst
Trades believe that Wednesday’s FOMC announcement is exceptionally important. Many institutions will place big bets after the report. It is impossible to know in advance if more dollars will buy or sell the news.
Because the Emini is again testing its all-time high, there is an increased chance that Wednesday’s move could be the start of a trend up or down that could last several weeks.
It is important to know that in a Breakout Mode situation, the initial breakout has a 50% chance of reversing. In addition, there is often no breakout and the market simply continues sideways.
Traders should be open to anything following the report. However, if a clear breakout begins, traders should look to enter in the direction of the breakout.
Trading Room
Traders can see the end of the day bar-by-bar price action report by signing up for free at BrooksPriceAction.com. I talk about the detailed Emini price action real-time throughout the day in the BrooksPriceAction.com trading room. We offer a 2 day free trial.
Charts use Pacific Standard Time
When I mention time, it is USA Pacific Standard Time (the Emini day session opens at 6:30 am PST, and closes at 1:15 pm PST). You can read background information on the intraday market reports on the Intraday Market Update page.