Al added some comments to report
Market Overview: Weekend Market Analysis
The SP500 Emini futures is reversing down from the top of bull channel on the weekly chart. The bears want November to be a bear bar on the monthly chart. That would increase the chance of lower prices in December. The bulls need bull bars on the daily chart this week if the year is going to close at a new high.
The EURUSD Forex is reversing higher after a test of the June 19, 2020 low and a break far below the bear channels on the daily and weekly charts. This week’s bull reversal bar on the weekly chart is a strong bull signal bar for next week. If the bulls get strong follow-through next week, it could lead to a 2-legged sideways to up move and a transition into a trading range for a couple months.
EURUSD Forex market
The EURUSD weekly chart
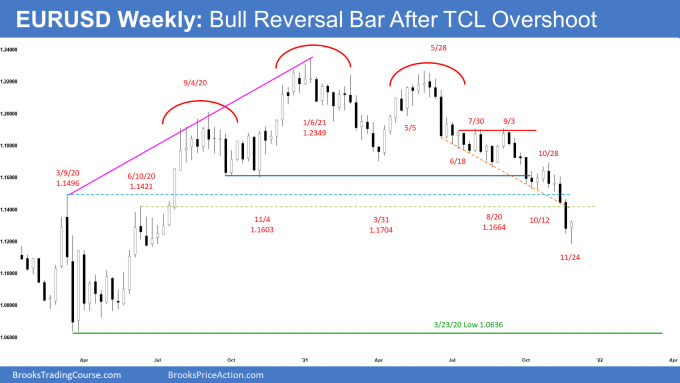
- This week’s candlestick on the weekly EURUSD Forex chart was a bull reversal bar closing just slightly off its high with a long tail below after testing to just above the June 19, 2020 low.
- Al has been saying that the EURUSD has been in a support zone for a few weeks and that it will likely reverse up for at least a few weeks. Most likely, it will form a trading range for at least a couple of months.
- This week’s bull reversal bar is a good buy signal bar for next week, especially since it is reversing up from a breakout below a bear channel. A breakout below a bear channel has a 75% chance of failing within about 5 bars. This is a good candidate for a reversal back up toward the middle of the channel. It can get there by going sideways or up.
- The bulls will need strong follow-through buying over the next 1- to 2-weeks. If they get that, it will lead to a 2-legged sideways to up move that typically lasts around 10 or more bars. On the weekly chart, that is at least a couple months.
- If those legs are strong, there could be a rally back to the October 28 high, which was the start of the most recent sell climax and therefore a magnet.
- If the reversal is more sideways, there could be a new low. The bears are hoping that this rally will quickly form a bear flag and then resume the yearlong bear trend.
- However, with the chart in a 7-year trading range, traders still expect a couple of months of sideways to up trading to begin soon. Legs rarely go straight from the top to the bottom without some confusion, which is a hallmark of a trading range. This year has been clearly bearish. Clarity does not last forever in trading ranges.
- The 2021 selloff is still more likely a pullback from the 2020 rally than a resumption of the bear trend that began 14 years ago. A reversal up is likely before there is a breakout below the bottom of the 7-year range.
- There is only a 30% chance that this selloff will continue down with only brief pullbacks and then break strongly below the 7-year trading range.
The EURUSD daily chart
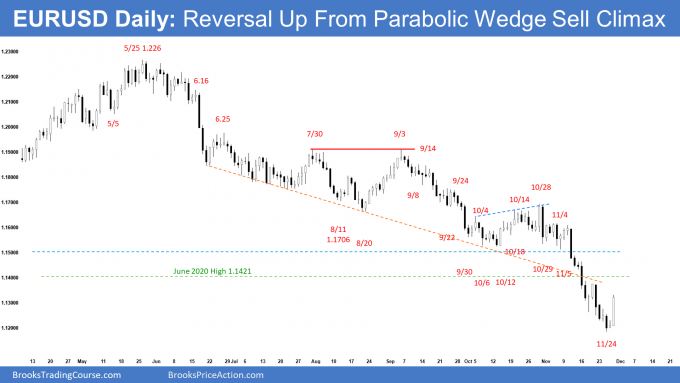
- The EURUSD traded lower by Wednesday but reversed up from a 7-day parabolic wedge sell climax on Friday.
- Al said that the recent selloff to below the bear channel was extreme. There is often a final plunge to a wedge bottom, like here, and then the exhausted bears begin protracted profit-taking.
- A common minimum expectation is TBTL… Ten Bars and Two Legs. As I wrote above, this week could be the start of a trading range over the next couple months.
- The bears are hoping that this rally will quickly form a bear flag and continue the yearlong bear trend.
- Because the EURUSD reversed up strongly on Friday from a failed breakout below a bear channel, traders should expect at least a couple of legs sideways to up on the daily chart.
- Since 2 legs are the minimum, traders will buy the first 1- to 3-day selloff after the 1st rally from the bottom.
- The first target for a reversal up after a sell climax is the most recent lower high which is November 18 high. The bulls want a measured move up above that high. The bears will try to get another leg down from a double top with November 18 high. If those legs up are strong, there could be a rally back to the October 28 high.
- If the reversal is more sideways, there could be a new low. However, with the chart in a 7-year trading range, traders still expect a couple of months of sideways to up trading to begin soon.
S&P500 Emini futures
The Monthly Emini chart
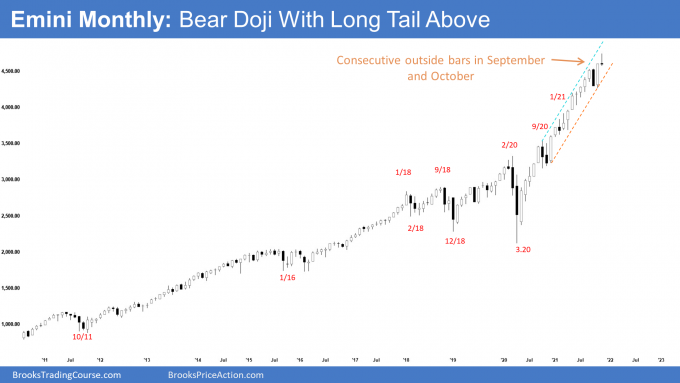
- The November monthly Emini candlestick currently is a bear doji with a long tail above. The breakout above the Sept-Oct OO (outside-outside) pattern seems to be failing.
- There are 2 more trading days before the monthly candlestick closes. The bears want to extend the bear body by closing below Oct or Aug-Sept highs, and they want the bar to close near its low. That would probably lead to lower prices in December.
- The bulls want the Emini to reverse back up on Monday and Tuesday to close at least above the middle of the bar at around 4660. The more bullish the bar, the more likely December will be higher and the year will close on the high.
- Al said that when October formed a big bear bar, that there should be a 2nd bear bar within 2 months. Sometimes it comes in the 3rd month. The Emini is back to the open of the month, and November might become that 2nd bear bar.
- If the bears get a bear bar, especially one with a reasonably big bear body and closes near its low, November will be a good sell signal bar on the monthly chart. Traders will look for a reversal down from a failed OO buy signal.
- Remember, September and October were consecutive outside bars, which created an OO Breakout Mode pattern. The buy triggered when November traded above the October high. If November forms a good bear reversal bar, it would be a reasonable sell signal bar for a failed OO buy signal. That would increase the chance of December trading down.
- Al mentioned that the year opened on its low and it is now at its high. On the yearly chart (Al will show the chart in early January), 2021 is a big bull bar that is currently closing on its high.
- Most big bull bars have conspicuous tails on top (in this case, 1 bar on the yearly chart is 1 year). It usually comes from a pullback just before the bar closes. That is why he said that there was an increased chance of a reversal in December. Bars often change their appearance just before they close, and what happens in December is just before the 2021 bar closes on the yearly chart.
- The computers know this tendency. Bull computers will try to overwhelm the bear computers and get the year to close on its high. That could even lead to a gap up in January, which would create a gap up on the daily, monthly and yearly charts. With the final trading day of 2021 being a Friday, there would also be a gap up on the weekly chart.
- Therefore, there is an increased chance of a big move in either direction in December.
- If the year closes on its high, there will be an increased chance of higher prices early next year.
- But if December is a bear bar closing near its low on the monthly chart, the new year will probably trade down.
The Weekly S&P500 Emini futures chart
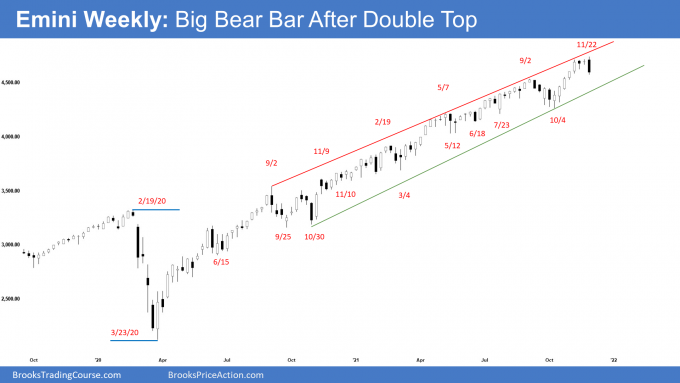
- This week’s Emini weekly candlestick was an outside bear bar with a small tail below, reversing lower from a higher high double top near the top of the bull channel.
- The candlestick after an outside bar often is an inside bar or has a lot of overlap with the outside bar. If it is an inside bar, it would form an ioi (inside-outside-inside) pattern, which is a breakout mode.
- Since this week is a bear bar closing near its low, it is a sell signal bar for next week. The bears need to create follow-through selling next week to increase the odds for a deeper pullback.
- Is this the start of a correction? The Emini has been in a strong bull trend since the pandemic crash. There have been a few times when the bears got the probability of a correction up to 50%, but never more. If there is follow-through selling early next week, this will be another one of those times.
- The probability of higher prices has been between 50 and 60% during this entire bull trend. It has never been below 50%. That continues to be true.
- The strong selloffs like in September push the probability for the bears up to 50%. But every prior reversal has failed, and the bears never had better than a 50% chance of a trend reversal.
- If the bulls get a strong reversal up next week, the probability of a new high by the end of the year will be again back to 60%.
- Next week should give traders an idea of what will happen in December.
The Daily S&P500 Emini futures chart
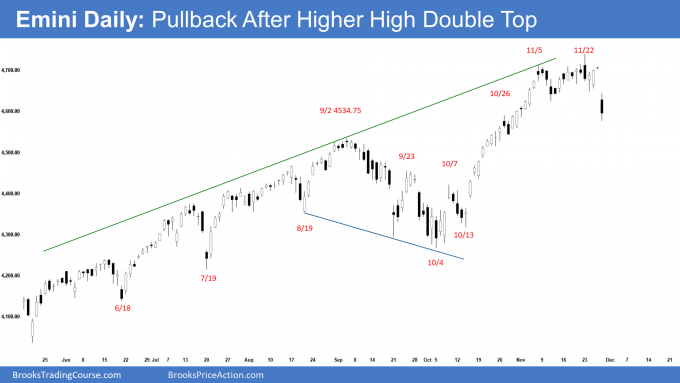
- The Emini made a new high on Monday but Monday reversed to close as an outside bear reversal bar closing near the low. Friday broke below the November 10 low, which is the neckline of the November 5/November 22 double top. It also broke far below the bull channel that began on October 4.
- While Friday closed well below that support, there was a conspicuous tail below. The bears will need strong follow-through early next week before traders will conclude that this is the start of a move down to the October low.
- The selloff was strong enough for traders to expect at least a small 2nd leg sideways to down.
- The Emini will probably dip below the September 2 high before the bulls can get a new high. That was the breakout point for the October rally, and with all of the trading range trading in August and September, a strong selloff should continue at least to a little below the breakout point. That would also be about a 50% pullback from the rally up from the October 4 low.
- The bears want a measured move down and then continued selling down to the October low.
- If they were to get that, there would probably be a bounce from that support. If there was then another reversal down from a lower high, there would be a head and shoulders top. September 2 would be the left shoulder and November 22 would be the head.
- Al has said that a major sell signal has a 40% chance of leading to a major trend reversal (here, into a bear trend). There would still be a 60% chance of the Emini continuing sideways or resuming up after a head and shoulders top.
- The bulls are hoping Friday is just a bear trap in a strong bull trend. They will need a bull bar closing near its high early next week to convince traders that the Emini will make a new high before the end of the year.
- The next few days should give traders an idea of what will happen in December.
Trading Room
Traders can see the end of the day bar-by-bar price action report by signing up for free at BrooksPriceAction.com. I talk about the detailed Emini price action real-time throughout the day in the BrooksPriceAction.com trading room. We offer a 2 day free trial.
Weekly Reports Archive
You can access all weekly reports on the Market Analysis page.
Hi, Al
Although I understand your perspective on the EURUSD (you’ve been saying that it would reverse any time since the big bear spike on the 14/June/2021), I cannot help questioning some points. Everything I’m gonna say is on the weekly chart. On the weekly chart, the EURUSD was in a bull trend (a weak one) since last year’s low and lasted until 04/Jan/2021 (just a little above a bear trend line that dates back to 2009), it then had a correction (04/Jan/2021 to 29/mar/2021) which broke the bull trend line and left EMA gap bars below the 20 EMA. It tried to resume the trend (bull bar on the 05 of April), but failed (22/Feb and 24/may DT, also 04/Jan and 24/may DT), that created a possible DT LH MTR at the bear trend line that dates back to 2009. That, in my opinion, was confirmed with the big bear spike on the 14/June/2021 (when I shorted). Although there was no immediately FT selling after the big bear spike, it had a weak bear channel (spike and channel) and left a gap between the 21/Jun bull bar high and the 07/June bear bar low (which was never closed). On the 23/August, price rallied to the 20 EMA and created a DT (26/July and 30/Aug DT or 02/August and 06/Sept DT) again a really good sell signal bar with good context, it was also a low 2 top (M2S) at EMA (which I shorted again). There was good FT selling with a bar closing on its low, a doji and a breakout below the 16/Aug low (last swing’s low). It touched the trend channel line (from the big spike and channel) and tried again to rally, this weak rally went just a couple ticks above the last breakout point (16/Aug low), but then closed as a reasonably good bear bar and also as a Low 1 outside bear bar (leaving open gaps above), it also created a negative gap and a possible MM down target. At this point, bulls had been unable to create at least 3 consecutive bull bars for a long time, and at this moment they still are. With all this happening, I could see no reason not to short it again and again. Price went below 11/Oct (last swing’s low) with a surprisingly big bear bar (reaching the trend channel line and the MM target created above with the negative gap), it again had surprisingly good FT selling, a big bear with not much tail below it. With all this happening and all the open gaps from last year to be filled (7 years trading range and considering that a TR has gaps being filled all the time) I think we’ve been always in short since the 14/June big bear spike. There is also a MM target from the double top high created at the 20 EMA (30/Aug high) and the breakout below 11/Oct low). Right now we’re almost reaching said MM target. There are also open gaps between the last 3 bear bars. I also look at the DXY to have some context and it has been clearly bullish for a while. I’m still short the EURUSD and I see it going at least to 1.10070 (last gap to be filled). What am I missing?
Thank you very much for your time.
I agree with everything that you are saying. However, the chart has been in a trading range for 7 years. Reversals are more likely than a breakout of the range and then a trend.
Since this yearlong selloff has been extreme without much of a bounce, yet it is only in the middle of the range, it is more likely that it will transition into a trading range for a couple of months. As you know, I have been saying that for a long time.
As you said, the breakout below the head and shoulders top was strong. However, the EURUSD is near the measured move target. Also, it is reversing up from a breakout below a bear channel on the daily and weekly charts. That is why a trading range is likely for a couple months.
Once in the trading range, there will be about a 50% chance of a resumption of the 2021 bear trend and a 50% chance of a reversal up. Traders will look for a measured move in either instance.
Would I be surprised if this selloff kept going straight down to below last year’s low? Yes, because of the 7-year trading range and the reversal up from below the channels.
However, traders should expect a trading range for at least a couple months before there is a break below last year’s low. There is no reason to believe that a break of the 7-year trading range will come any time soon.
There is nothing wrong with selling rallies… or buying reversals up. If a trader is holding for an investment (6 months or more), he can stay short even if there is a 500 pip bounce. I am a trader. I would rather buy the reversals up and sell reversals down, betting on a trading range for a couple months. And the upcoming trading range could easily be 500 pips tall.
I appreciate your answer (and time). I understand now that we’re talking about different time horizons. It’s ok for me to hold for 6+ months while “you have been there, done that and is going back for more”. Your way is much more lucrative than mine and you must have an insane sharpe ratio but I don’t think I can read all the market transitions that fast.
Thank you, Al.
Hi,
Surely that the opened gap at 21 Mar’20 and 27 May’20 are the magnets as you said. With the strong bear leg since 16 June could make the market to reach them. But as Al said, 19 June’20 is the important support. Now the bulls try to protect the bull channel starting from it and leave the gap opened. We’ve never knew yet if it is the bottom but the context is good for bull reversal. It was the sell climax late in the bear trend and breaking below bear channel with nested wedge bottom and 24-25 November formed a small triangle late in the bear trend on the smaller time frame. That’s why the bears took profit and the bulls started to buy aggressively on 26 November.
Hi
I read an article on some economic site that the market, has never bottomed at a Friday. I found this kind of superstitious,but do you have some feedback regarding this?
I’m not expert, but if you look at the weekly chart above, there are plenty of times where the week has ended on the bottom.
But maybe i don’t understand what you mean 🙂
Whenever someone says never or always, they reveal that they do not understand markets. Market probabilities for everything are between 40 and 60% most of the time, and their behavior is “never” 0 or 100%. Rarely, something is 70% likely.
It has to be this way because there must be a near-balance between buyers and sellers. They keep the price around where it needs to be to attract someone to take the opposite of your trade. If it goes too high, buyers stop buying and sellers get eager. If it gets too low, sellers stop selling and buyers buy aggressively. The result is a band where traders think the price is good enough for both buyers and sellers.