Market Overview: Weekend Market Update
The Emini triggered an oo buy signal on the monthly chart when July traded above the June high. That makes sideways to up likely for a few months.
The crude oil futures chart has rallied for 6 weeks in a yearlong trading range. It is now in the sell zone, but there is no top yet.
The EURUSD weekly Forex chart has transitioned into a trading range after a yearlong bear channel. There is now a 40% chance of a rally up to the January high.
Crude oil Futures market:
Bull leg in trading range
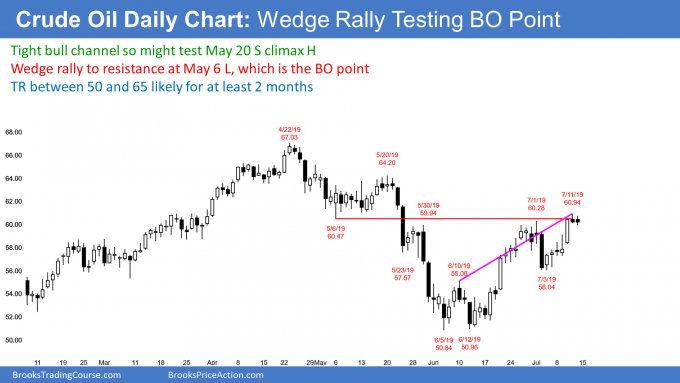
The crude oil futures market rallied this week after last week’s selloff. The bulls are hoping that the reversal up in June is a higher low major trend reversal. More likely, the rally is a bull leg in a yearlong trading range that will last many more months.
There are still magnets above and therefore the rally will probably go at least a little higher. For example, the top of the 2 big bear bars in May is a target. The top of any sell climax is always a magnet because many bears put protective stops just above the sell climax high. The bears are ready to give up there. Since they are thinking about giving up, there are fewer bears willing to sell once the rally gets near their stops. This lack of sellers often results in the stops getting hit. Because that was the target for the bulls, the bulls take profits and the rally often stalls at a sell climax high.
Additionally, the April lower high is resistance. Even if the bulls get a breakout above that high, there will sellers above it. This is because traders believe that the weekly chart is in a trading range. Traders look to sell above prior highs, especially near the top of the range.
Bull leg in yearlong trading range
I said this 6 week rally is a bull leg in a yearlong trading range. That means that there will be a bear leg. I have been saying that the approximate sell zone is between 60 and 70. That April 23 high is 67.03 and is a reasonable target for the rally.
The bears want to sell, but they want a bear bar closing near its low for a sell signal bar. They do not have that. They will also sell if they see a surprisingly big bear bar closing near its low. Until they get what they want, the odds favor at least slightly higher prices.
Is it possible that the weekly chart is now in a bull trend? The bulls have a credible higher low major trend reversal. Last year’s selloff was so strong that there is currently only a 30% chance that this rally will get up to last year’s high. It is more likely that the rally will stall within a few weeks and the chart will then go sideways to down for a month or two.
EURUSD weekly Forex chart:
Higher low near bottom of 5 month trading range
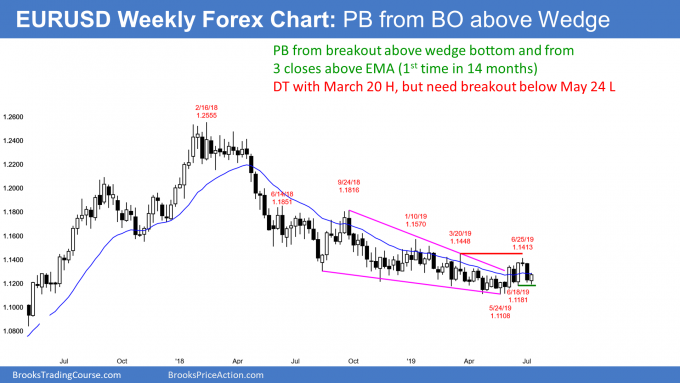
The EURUSD weekly Forex chart formed a small bull bar this week after last week’s selloff. This week was a higher low in what the bulls hope is a new bull trend. It is therefore a buy signal bar for next week.
The weekly chart was in a bear channel for a year. It has been in a trading range for 5 months. Every trading range is always also in bull trend and a bear trend. It is still in a broader bear channel, despite last month’s breakout above the tight bull channel. The bulls are hoping that this week will be a higher low in a bull channel.
Until there is a clear breakout of the range, traders will continue to bet on reversals. They will buy selloffs, sell rallies, and take profits after a bar or two.
Bear channel evolved into trading range
The yearlong pattern of reversals down from the 20 week EMA changed in early June. June had 3 closes above the EMA. That had not happened in over a year. It is therefore a sign that the bulls are getting stronger and the bears are becoming less aggressive.
The weekly chart had been in a weak bear trend. That meant that lower prices were likely. Now, the bulls have at least a 50% chance of a move above the June high. Further more, they have a 40% chance of a test of the January high.
Monthly S&P500 Emini futures chart:
Emini oo buy signal makes higher prices likely
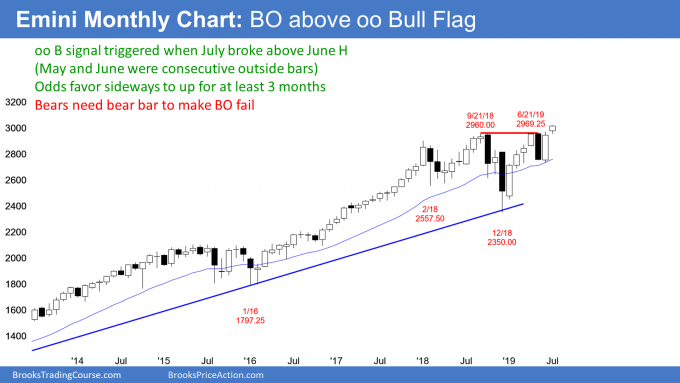
The monthly S&P500 Emini futures chart has a small bull trend bar so far in July. July is a breakout above the September/May double top and the 19 month trading range. The bigger a breakout is, the more likely it will be successful. However, a small bull bar is still good for the bulls.
It is important to remember that June was an outside up bar after an outside down bar in May. July trigger an oo (consecutive outside bar) buy signal by trading above the June high. There is now a 60% chance that the next 3 months will be sideways to up.
The bears want the breakout to fail. They need a bear bar closing near its low to convince traders that a reversal down is about to begin. Additionally, they want a big bear bar. That will attract more sellers in August and increase the chance of a failed breakout. Until they get it, the bulls will remain in control.
Expanding triangle top
I have been writing about a possibly expanding triangle top since the strong reversal up in January. The top of the triangle is the line drawn across the January 2018 and September 2018 highs. That line is currently around 3040.
Most reversals come from undershoots or overshoots. They rarely come exactly at support or resistance. July has not reached the line. If there is a reversal down from here, there would be an undershoot.
Overshoots are slightly more common. On the daily chart, traders look for 1 – 2% overshoots. That means if the rally continues up to 3,100 – 3,150, traders will become more wary of a reversal. Since there is room to that area and the oo buy signal should have follow-through this summer, the odds continue to favor at least slightly higher prices.
Everyone knows that big reversals often come in August, September, and especially October. Traders will remain cautiously bullish for at least a few more months.
Example of expanding triangle top on monthly chart in 1973
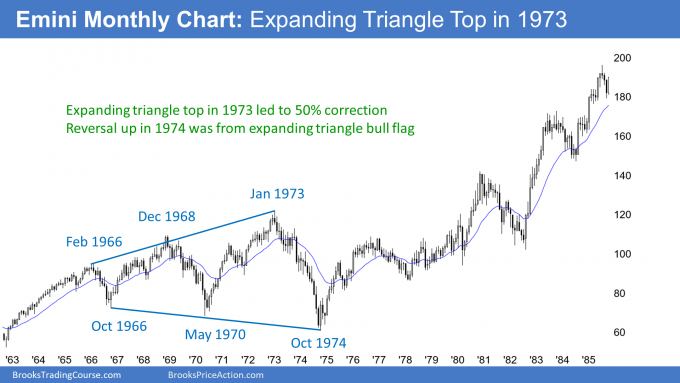
For an example of an expanding triangle top in the S&P500 monthly chart, look back at the January 1973 high. It was the 3rd leg up where February 1966 and December 1968 were the 1st 2 legs up.
A reversal down from an expanding triangle top often leads to an expanding triangle bull flag. That is what happened then. The stock market has been in a strong bull trend on the monthly chart since that October 1974 low, despite a few big 2 – 3 month selloffs.
Weekly S&P500 Emini futures chart:
Consecutive bull bars breaking above September/May double top
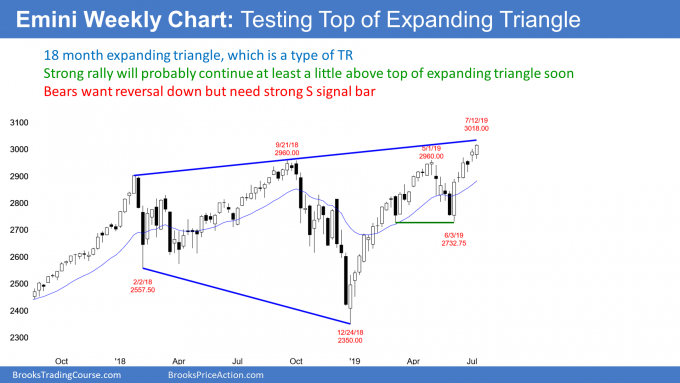
The weekly S&P500 Emini futures chart broke above the September/May double top last week. This week was the 2nd consecutive bull trend bar on the weekly chart. When a breakout has consecutive bull bars, traders see the 2nd bar as confirmation. They conclude that the breakout is succeeding and they expect higher prices. With this week closing on its high, next week might gap up.
The weekly chart has the same expanding triangle top that is on the monthly chart. Since there is room to the top of the triangle and there are now consecutive bull bars, the probability favors at least slightly higher prices.
The bears want the breakout to fail
There is always a bear case. If next week is a bear trend bar, traders will wonder if the 2 week breakout will fail. However, after 2 strong bull bars, the bears will probably need at least a micro double top before they can reverse the trend. Consequently, the 1st reversal down will probably be only a 1 – 2 week pullback.
Unexpected events (black swans) can come at any time. If next week forms a surprisingly big bear bar closing near its low, it will overwhelm the past 2 weeks. If the bear bar is huge, traders will conclude that the breakout has failed. They will then assume that a reversal down from an expanding triangle top is underway. By definition, a Bear Surprise Bar is a surprise, which means that it is unlikely.
Daily S&P500 Emini futures chart:
Tight bull channel but buy climax
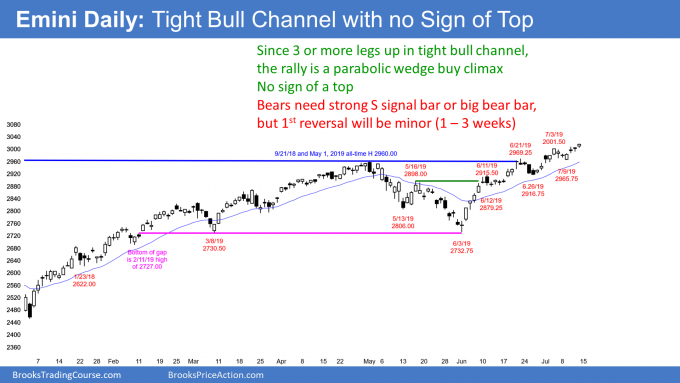
The daily S&P500 Emini futures chart has rallied strongly from the June 3 low. Once the Emini pulled back on June 11, the spike (breakout) phase of the bull trend ended. The channel phase began with the June 12 low. A breakout followed by a channel is a Spike and Channel Trend. It typically evolves into a trading range.
There are now 4 pushes up in a tight bull channel. Once a tight bull channel has at least 3 legs up, it is a parabolic wedge. That is a buy climax. While the rally can continue indefinitely, the bulls usually begin to look to take some profits once a rally becomes climactic.
In 25% of bull channels, the market accelerates up and successfully breaks above the bull channel. It then is again in a breakout phase. Over time, the breakout has a pullback. The trend weakens and enters a channel.
Bull channel is a bear flag
Most of the time, a bull breakout above a bull channel fails within 5 bars. The market then reverses and has a bear breakout below the bull channel. Whether or not there is a failed bull breakout, there is a 75% chance of a successful bear breakout below the bull trend line. That means that a bull channel behaves like a bear flag.
Traders expect the eventual bear breakout to lead to a swing down and a transition into a trading range. Once there is trading range price action, the chart is in breakout mode. The bulls want a bull breakout and a resumption of the bull trend. However, the bears want a bear breakout and a reversal of the bull trend into a bear trend.
How does a bear swing begin?
This bull channel will eventually exhaust itself and evolve into a trading range. Until it does, the odds favor higher prices. But the rally already has 4 legs up. Consequently, the bulls will be quick to take profits if they see signs of exhaustion.
The most obvious one would be a big bear reversal day that makes a new high and closes on its low. Perfect setups only exist on dishonest websites. Most of the time, a reversal is less clear. When in doubt, stay out. Wait to see convincing evidence that the bears are in control before shorting.
For example, if there is a weak sell signal bar, wait to see if there is a 2nd signal bar a few days later. Or, look for 2 consecutive big bear bars or three consecutive smaller bear bars. A single huge bear bar is often reliable evidence that the bulls are taking profits.
One of these tops should form within the next few weeks. But the oo buy setup on the monthly chart means that the Emini will probably be sideways to up for at least 2 or 3 months. Therefore, traders expect the 1st reversal down to be minor. That means a 2 – 4 week pullback followed by another test of the high.
Trading Room
Traders can see the end of the day bar-by-bar price action report by signing up for free at BrooksPriceAction.com. I talk about the detailed Emini price action real-time throughout the day in the BrooksPriceAction.com trading room. We offer a 2 day free trial.
Charts use Pacific Standard Time
When I mention time, it is USA Pacific Standard Time (the Emini day session opens at 6:30 am PST, and closes at 1:15 pm PST). You can read background information on the intraday market reports on the Intraday Market Update page.