- Market Overview: Weekend Market Analysis
- 30-year Treasury Bond futures
- Bond futures weekly chart forming double bottom at bottom of a 8-month trading range
- EURUSD Forex market
- EURUSD weekly chart has been reversing every week in an 8-week tight trading range
- S&P500 Emini futures
- Monthly Emini chart is breaking above a weak High 1 bull flag buy signal bar
- Weekly S&P500 Emini futures chart has weak breakout above the September high
- Daily S&P500 Emini futures chart is stalling at the September high
Market Overview: Weekend Market Analysis
The SP500 Emini futures market broke to a new all-time high this week on an Emini weak breakout, and reversed back down. The Emini will probably have to go sideways for several more days before traders will decide if the Emini will resume up or reverse down.
Bond futures on the weekly chart have a weak reversal up at the bottom of an 8-month trading range. Because the bear channel is tight and the buy signal bar has a bear body, the reversal up will probably be minor.
The EURUSD Forex on the weekly chart has been reversing every week or two for 2 months. This is a neutral market. Traders are deciding if the correction from the wedge top has ended.
30-year Treasury Bond futures
Bond futures weekly chart forming double bottom at bottom of a 8-month trading range
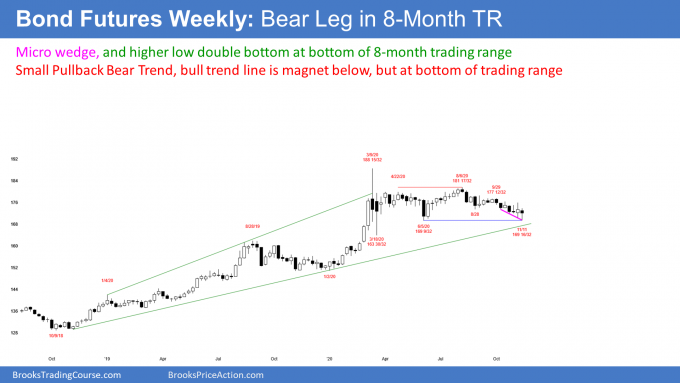
The bond futures market has sold off for 4 months. However, it has been in a tight trading range for 8 months after the most extreme buy climax in history. I have been saying since the March climactic reversal down that the bond market would be sideways for a long time, and possibly a year or more. So far, this has been correct.
This week reversed up from the bottom of the 8-month trading range. There is now a double bottom with the June low. The location is good for the bulls, but the buy signal bar and the tight bear channel are not.
This week was not a big bull bar closing on its high. Traders do not see it as a strong buy signal bar for next week.
Additionally, the 4-month bear channel has been tight. A breakout above a tight bear channel usually leads to a trading range and not a bull trend. Therefore, if the bond market works higher over the next few weeks, it will probably stall around the September lower high, which is in the middle of the 8-month trading range.
Rates will go much higher, but when?
Everyone knows that there will eventually be a breakout of the trading range. I have been saying that the bond market will be lower 5 years from now, which means interest rates will be higher. But it could still test the August high or even the March high in the meantime.
If it was clearly on the way down to the November 2019 low at the bottom of the final buy climax, it would not still be in the 8-month range. Until there are a couple closes below the June low or above the August high, traders will continue to bet on reversals. Since it is reversing up from the bottom of the range, traders expect at least slightly higher prices next week.
EURUSD Forex market
EURUSD weekly chart has been reversing every week in an 8-week tight trading range
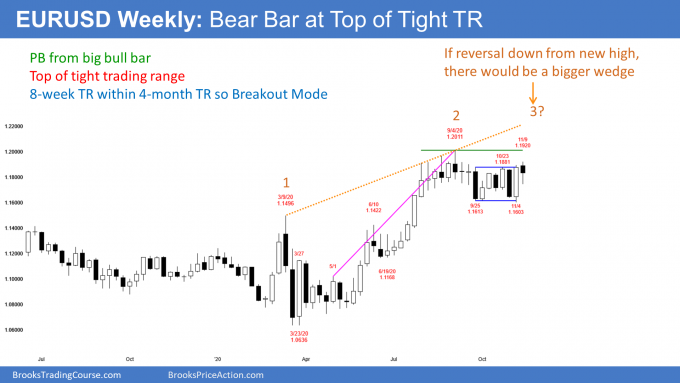
The EURUSD Forex market on the weekly chart has been sideways for 4 months. It rallied strongly this summer, but the bull channel had 3 legs. It was therefore a wedge buy climax. Traders then expected the rally to go sideways to down for a couple legs and 10 or more bars (weeks), and it has.
The wedge also formed a double top with the September 2018 high. That was the start of a 2-year bear channel. When there is a reversal up from a bear channel, a market typically stalls at around the start of the channel, and then the chart converts into a trading range. This is what has been happening on the weekly EURUSD chart. The 4 months of sideways trading has had a couple sideways legs and it lasted about 10 bars. That meets the minimum expectations.
8-week tight trading range is a limit order market
At this point, the bulls are looking to buy. But there is no clear buy setup yet. The past 8 weeks have been in a tight trading range and the bars have been big. The market has been reversing almost every week. That is bad for traders looking for a trend.
A tight trading range is a limit order market. That means there are typically more sellers than buyers above, and more buyers than sellers below. It is a low-probability environment for stop entry traders, who are hoping for a breakout into a trend. Also, the big bars mean the stop is going to be far away. That results in bad risk/reward for stop entry traders.
4-month trading range is Breakout Mode
The strong summer rally broke above the March high and the June 10 high. Once a chart evolves into a trading range, there is usually a dip below the breakout points. Traders are wondering if the 4-month pullback will work down to the June 10 high, or if the bulls will get another leg up first.
Once a trading range has about 20 bars, the probability of a successful bear breakout is about the same as for a bull breakout. That is a Breakout Mode market.
If the bulls get a successful breakout, they would like it to reach the February 2018 high at around 1.25. If instead it reversed down before reaching that target, there would then be a bigger wedge rally. The 1st leg up would be to the March 9 high and the 2nd leg would have ended on September 1. A bigger wedge should lead to a bigger reversal. The target again would be the June 10 high.
What is likely over the next few weeks?
Markets have inertia. They tend to continue doing what they have been doing. Traders will therefore bet on reversals over the next few weeks until there are a couple consecutive big bull bars closing above the September high or a couple big bear bars closing below the November low.
Also, a trading range is an area of agreement. If the bulls get a breakout above the September high, it will more likely reverse back into the range before reaching the February 2018 high.
Additionally, if the bears get their breakout, the selloff will probably not continue down to the March low. Instead, the EURUSD would likely get pulled back up into the trading range within a month or two.
S&P500 Emini futures
Monthly Emini chart is breaking above a weak High 1 bull flag buy signal bar
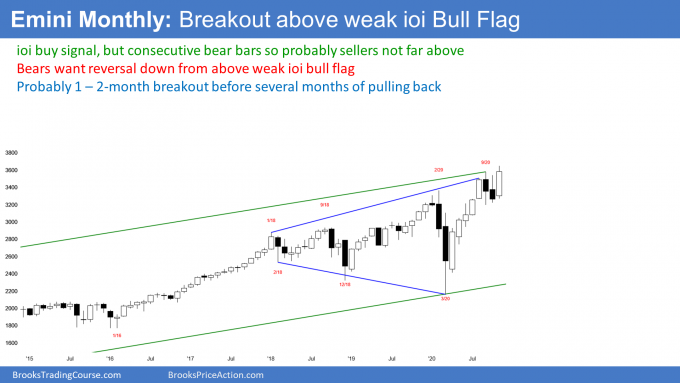
The monthly S&P500 Emini futures chart had an inside bar last month in a bull trend. October was therefore a High 1 bull flag buy signal bar.
But it had a big bear body and it followed a big bear bar in September. That is a weak buy signal. There will probably be sellers not too far above the October high.
While the rally might last another month or two, it is unlikely to continue up strongly from here. Traders should expect a deeper pullback to begin within the next few months. Because the rally has been climactic, there will probably be a couple legs sideways to down and lasting at least 4 – 6 months. That means that the Emini will probably be in a trading range for the 1st half of next year, and it is now likely near the top of the range. It could last longer, but that is a reasonable expectation at this point.
What happens if November and December are both big bull bars closing on their highs? That would be a bull surprise, and a surprise usually has at least a small 2nd leg up. The bulls currently have a 40% chance of several more months of higher prices before there is a pullback.
Weekly S&P500 Emini futures chart has weak breakout above the September high
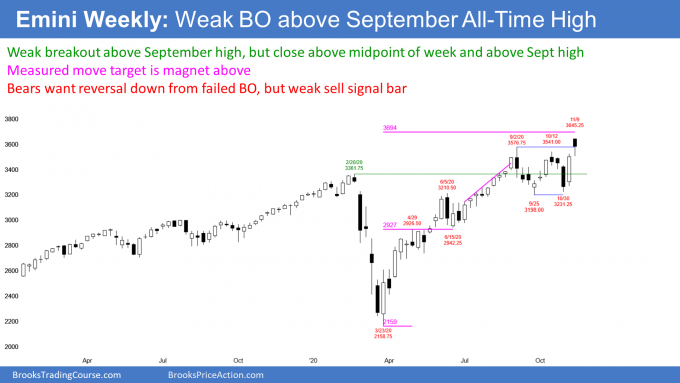
The weekly S&P500 Emini futures chart gapped up this week to a new all-time high, but sold off and closed the gap. This week closed in the middle of its range. It therefore is a weak sell signal bar for next week.
The bulls expect that the reversal down will be minor. They will look for a bull bar within the next couple weeks. That would be a High 1 bull flag buy signal bar. They then would want a resumption of the bull trend and a new all-time high.
Reversal down or a pullback in bull trend?
What is more likely, a reversal down, or a pullback and then a resumption up? This is the most common and most important question that traders face. There are many variables.
There was a big gap up and a big reversal down this week. Big Up, Big Down creates Big Confusion. Traders need more information. They will get that over the next couple weeks. If there are 2 or 3 big bear bars closing near their lows, traders will conclude that this week will remain the high for the year.
But if there is a good buy signal bar next week or the following week, traders will bet that the rally will make a new high before the end of the year.
Therefore, next week will be important. But it will probably disappoint the bulls and bears because the confusion should lead to a pause for at least a week or two. However, the trend is up and this is not a strong sell signal. The odds favor higher prices, even if there is a pause for a few weeks.
Daily S&P500 Emini futures chart is stalling at the September high
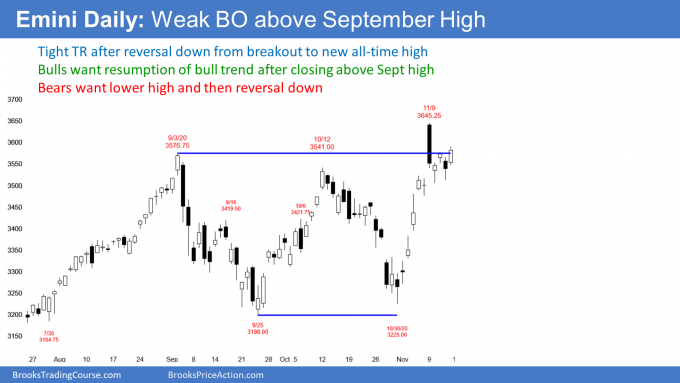
The daily S&P500 Emini futures chart broke to a new all-time high on Monday, but sold off and closed below the September 2 high, which was the former high. This is disappointing for the bulls. When there is a breakout to a new high, they want the day to close above the old high.
On Wednesday, the bulls got a close that was barely above the September 2 all-time high close, but Thursday closed back below that high. This is not what typically happens when a breakout will go far above the old high. It increases the chance that the Emini might have to go sideways more before it can go higher.
There is another problem with the 2-week rally. While the rally covered a lot of points, look at the bars. Nine of the past 12 bars closed either in the middle of its range or around its open. Those are not strong bars.
Where are several consecutive bull bars closing near their highs? That is what typically happens when a rally is going to continue much higher. Therefore, while the rally has gone up far and fast, and traders expect higher prices, the bars are not strong. This is probably not the start of a strong move up.
And the failure to have a close far above the September high is another sign of hesitation on the part of the bulls. This reduces the chance of the rally racing up strongly next week. The Emini probably has to go sideways to down for at least a few more days, before the bulls will consider buying aggressively again.
Can Monday’s big selloff remain the high for 2020? The bulls have a 40% chance. But if the Emini begins to reverse down strongly for several days, traders will conclude that there will not be a new high until next year.
Trading Room
Traders can see the end of the day bar-by-bar price action report by signing up for free at BrooksPriceAction.com. I talk about the detailed Emini price action real-time throughout the day in the BrooksPriceAction.com trading room. We offer a 2 day free trial.
Charts use Pacific Standard Time
When I mention time, it is USA Pacific Standard Time (the Emini day session opens at 6:30 am PST, and closes at 1:15 pm PST). You can read background information on the intraday market reports on the Market Update page.


Just reviewing Friday’s emini price action… Is that a parabolic wedge?
…referring to Globex chart, Thursday close into Friday close.
for some reason why my emini daily chart doesn’t seem has much gaps like your chart, and candles are closed near its high, which means bullish to me.
You might be looking at the continuous emini chart. Al’s charts only include data from the cash market (9:30 am – 4:00 pm Eastern Time).
Very clear report Al, thank you. And Admin, the accessibility is much better with the link buttons you’ve changed and where you put them.