Monthly S&P500 Emini candle chart: Doji outside bar
The monthly Emini candle closes in two weeks, and it is currently an outside doji candle that is testing the top of the bull trend channel.
The monthly S&P500 Emini chart continues to be overbought and it is at the top of the bull trend channel, but there is no sign of a top.
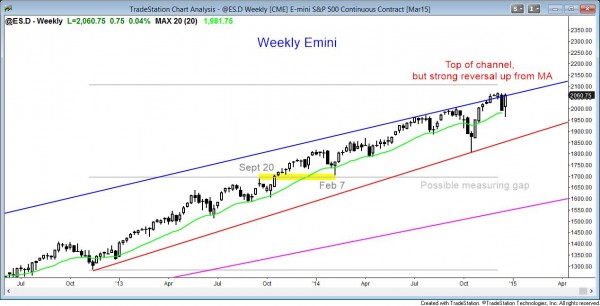
Weekly S&P500 Emini candle chart: Strong reversal up from the moving average
The weekly Emini chart reversed up strongly from a test of the moving average.
The weekly S&P500 Emini chart reversed up strongly from the moving average, but it is at the top of the bull trend channel. There is still a measured move target around 2100 from the gap below the February 7 low. The bears want a micro double top at the all-time high from earlier this month, and the bulls want a breakout and measured move up. This week’s reversal was so strong that a breakout above the December 5 high is more likely than a double top.
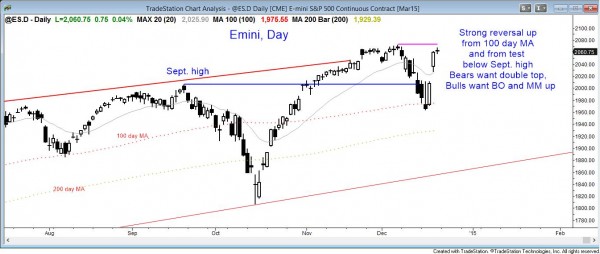
Daily S&P500 Emini candle chart: Bull trend reversal after a breakout pullback test of the 100 day moving average and the September high
The daily Emini reversed up strongly from a test of the 100 day moving average and the breakout above the September high.
The daily S&P500 Emini chart reversed up strongly this week from the 100 day moving average and from a test below the September 5 high, which was the breakout point for the October and November rally. The bears want this week’s bull trend reversal to fail around the December 5 high and create a major trend reversal. They see this week’s rally as a buy vacuum test of resistance.
The bulls see this rally as a strong reversal up from a test of support. The bull trend reversal was strong enough to make the probability of a breakout to a new all-time high greater than that of a double top. However, if the Emini again enters a tight trading range here, like it did earlier this month, the probability can fall to around 50% for both the bulls and the bears. Since next week is Christmas week, which usually has protracted 5 minute tight trading ranges and small, trading range days, the odds of a strong breakout to a new all-time high next week are low. The Emini more likely will begin to get very quiet until after the New Year.
The bears need a credible top, which they do not have, or a strong bear breakout with follow-through. Until then, this reversal up has flipped the always in position back to long.
Traders can see the end of the day bar-by-bar price action report by signing up for free at BrooksPriceAction.com. I talk about the detailed Emini price action real-time throughout the day in the BrooksPriceAction.com trading room, and a 2 day free trial is available.
When I mention time, it is USA Pacific Standard Time (the Emini day session opens at 6:30 am PST, and closes at 1:15 pm PST). You can read background information on the intraday market reports on the Intraday Market Update page.


