Monthly S&P500 Emini candle chart: Bear inside bar in a buy climax
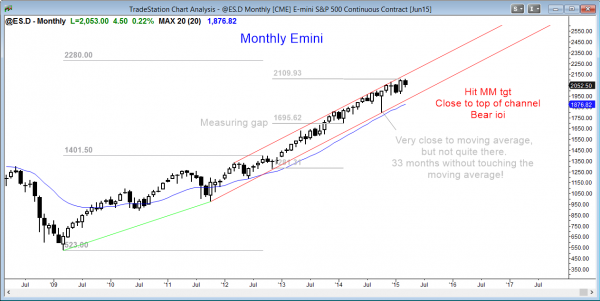
The monthly Emini candle chart is forming a bear inside bar after an outside bar. This ioi is a breakout mode setup.
The monthly S&P500 Emini candle chart is extremely overbought, and this ioi pattern is a potential top. There are 2 trading days left to the month. The bears want the month to close on its low, which would create a strong sell signal bar. The bulls want as big a tail on the bottom of this month’s candle as possible so that the sell signal would be weaker and there would be a greater chance of the market going sideways instead of down. If they are successful, this small tight trading range would be a bull flag.
The Emini has not touched the 20 month exponential moving average (EMA) in 33 months. Traders learning how to trade the markets should pay attention to extreme behavior because it can be followed by a surprisingly big reversal. The S&P500 cash index has only been above its 20 month EMA for this many bars twice in the past 50 years. The first time was 1987, and it was followed by a crash. This is unlikely, as are all crashes. The second time was in 1998 and it was followed by a brief selloff of over 20%.
When a bull trend is in a tight channel for an exceptionally long time, many buyers are momentum bulls. They keep buying as long as the tight bull channel continues. As soon as the momentum weakens, they exit quickly and do not look to buy again for at least a couple of legs and about 10 bars down. This is probably what will happen this time. Is this month’s ioi the sell signal that leads to a test below the moving average and the October low? No one knows, but I believe that the odds of this happening at some point this year are at least 60%.
If the bears can close the month on its low on Tuesday, that will create a more credible sell signal bar for traders who trade the monthly chart. If this month is an inside bar, like the ioi in January, is it a buy setup as well? Yes, but I think that it is very dangerous to buy at the top of a buy climax, hoping that a greater fool is willing to buy from you even higher so that you will be able to make a profit.
Weekly S&P500 Emini candle chart: Wedge top in a tight bull channel
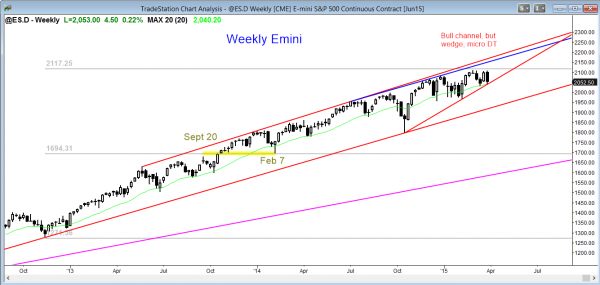
The weekly Emini candle chart is in a bull channel that has gone on for several years, and in a tight trading range for the past 4 months. It is overbought and it is forming a potential wedge top, but the market is still holding above the moving average and all bull trend lines.
The weekly S&P500 Emini candle chart is still in a bull channel, but it has flattened out and it is also in a tight trading range for four months. This is a breakout mode pattern. If the bulls are successful, the chances are that this trading range will be the final bull flag since it is forming in a very overbought bull trend at the top of a bull channel. Although the Emini is still in a bull trend, this small double top at the top of the tight trading range could lead to a reversal down.
The bears need a strong breakout below the moving average and the bull trend line. Without it, the weekly chart is still always in long. Bulls have to be very careful not to buy at the top of the range. If they want to buy, they should be looking for scalps. On the weekly chart, that means trades lasting up to a few weeks. Experienced bears can sell breakouts above the top of the trading range and scale in higher. Most traders should wait for a clear sell signal bar or for a strong bear breakout before shorting on the weekly chart.
Daily S&P500 Emini candle chart: Double top and double bottom bull flag
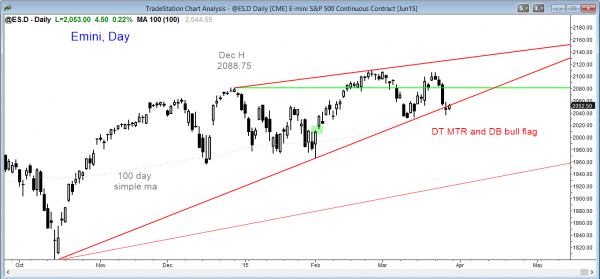
The daily Emini candle chart is in a double top at the top of a fourth month trading range. It also has a double bottom at the bull trend line. It is in breakout mode for a measured move up or down. There is a wedge top as well, but when the shape is not good, not as many computers will place trades based on it and this lowers the probability of a reversal.
The daily S&P500 Emini candle chart has both a double bottom bull flag and double top major trend reversal at the top of a bull channel. It is in breakout mode. If there is a bull breakout, the market might rally for a measured move up, but this has at least a 50% chance of being the final bull flag before a bigger correction develops. If there is a bear breakout, the market could quickly fall for a measured move down to around 1960 at the bottom of the 4 month trading range. If it breaks below there, the next target is the October low.
Traders can see the end of the day bar-by-bar price action report by signing up for free at BrooksPriceAction.com. I talk about the detailed Emini price action real-time throughout the day in the BrooksPriceAction.com trading room, and a 2 day free trial is available.
When I mention time, it is USA Pacific Standard Time (the Emini day session opens at 6:30 am PST, and closes at 1:15 pm PST). You can read background information on the intraday market reports on the Intraday Market Update page.


The market tried to form a wedge top in late 2012, but instead had a bull breakout. Whenever there is a bull breakout above a bear flag, computers will look for a measured move up.
Hi Al, was the largest measured move on the monthly charch based on a breakout of a trading range or double top? If not what was the measured move based on? Thank you