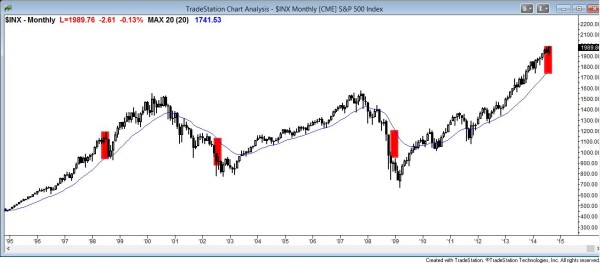
The monthly chart of the S&P500 cash index has only been this far above the moving average 3 other times in the past 20 years. Even though it might get further from the moving average, it will probably do what it did after those prior times and reverse back to the moving average. The 3 prior reversals moved at least 20%. The current rally is a small pullback bull trend, which is the strongest type of bull trend. This makes a 20% correction unlikely unless the bears are able to generate some selling pressure (big bear trend bars) over the next several candles (months).

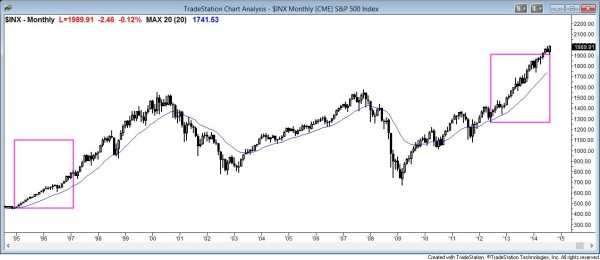
The width of the pink box on the right shows how many bars it has been since the monthly S&P500 has touched the moving average. This has happened only once before in the past 20 years. The last time was from 1995 to 1999 (the pink box on the left), and it held above the moving average for many more bars than the current rally. It eventually had about a 20% PB to the moving average. The current series of gap bars (lows above the moving average) can continue to grow. However, since the market has not had this many gap bars since 1999, it is likely that the S&P500 will soon pull back to the moving average.
The monthly S&P500 Emini candle chart is overbought
The two charts above show two signs of how extreme the buy climax is on the monthly chart. It is rare for the monthly chart to be this far above the moving average and for it to not touch the moving average for this many bars. This is climactic price action. The Emini does not have to reverse down sharply to get back to the moving average. If it simply goes sideways for many months, it will get there. Sideways means that it would be in a trading range. A reasonable height for a trading range on the monthly chart, based on prior trading ranges, is about 100 to 200 points.
The monthly chart is in a small pullback bull trend. This is the strongest type of trend and the first reversal attempt usually cannot go very far. This limits the downside risk. However, the Emini could pull back for 3 to 6 candles (months) and fall 100 (or even 200) points to the moving average on the monthly chart. If it did, this would appear as a minor pullback on the monthly chart, even though it would be a bear trend on the daily chart.
It is possible that the current rally can continue for many more bars. However, since the S&P500 was this overbought so rarely in the past 20 years, this is not likely. It is more likely that it soon begins to go sideways to down to the moving average.
The monthly Emini candle is an outside bar (its low was below last month’s low and its high was above last month’s high). Although it has one more week before we know the final appearance of this month’s candle, it currently is also an outside up bar. This means that its close is above last month’s high, creating a gap between the close and last month’s high. Going into next Friday’s close, the bulls will try to maintain the gap (close above the July high) to create buying pressure. This would increase the chances that the Emini would then trade higher. Even if the bulls succeed, when a gap occurs this late in a trend, it is more likely to become an exhaustion gap rather than a measuring gap. It is a type of buy climax. The bears always want the opposite. They will work to get the close of the month to stay below the July high.
Price action on the weekly S&P500 Emini candle chart

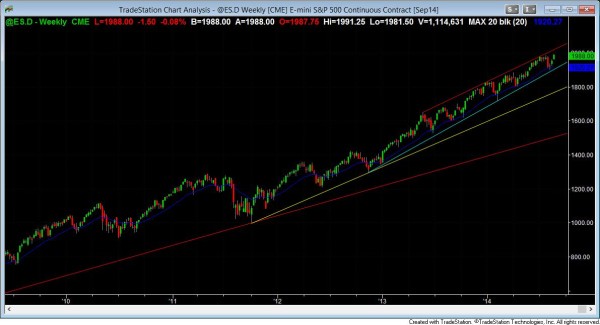
The weekly S&P500 Emini closed above the July high, which means that it is breaking out. Since it is at the top of the channel, the breakout probably will fail to go very far before the Emini reverses down to test the bottom of the channel (one or more of the trend lines below).
The weekly Emini chart had a bull trend candle this week and it closed above the July high. This is a gap and a breakout. The bar is not big so the breakout is not yet strong. Also, when a gap occurs this late in a trend, it is more likely an exhaustive buy climax rather than a measuring gap (a gap that would be followed by a measured move up).
The weekly chart is also at the top of the bull channel. It might break above it for several candles (weeks), but there are two chances in three that it will soon test the bottom of the channel, which is the bull trend line below. There are several bull trend lines, and the nearest one is just above 1900. Although it will eventually pull back to all of them, including the one that is now below 1600, it probably will not get there for at least several years. Since the bull trend lines are rising, they will be much higher when the Emini finally touches them.
Traders can see the end of the day bar-by-bar price action report by signing up for free at BrooksPriceAction.com. I talk about the detailed Emini price action real-time throughout the day in the BrooksPriceAction.com trading room, and a 2 day free trial is available.
When I mention time, it is USA Pacific Standard Time (the Emini day session opens at 6:30 am PST, and closes at 1:15 pm PST). You can read background information on the intraday market reports on the Intraday Market Update page.