Trading Update: Monday October 31, 2022
Emini pre-open market analysis
Emini daily chart
- The Emini got back to 3,900 last week and will probably have to reach 4,000 sometime this month.
- While the rally from October 13th is strong, it is still more likely a leg in a trading range than a bull trend.
- The problem with the bull trend argument is that the rally up to October 28th has a lot of overlap and lousy follow-through.
- The bulls have a potential measuring gap (October 18th high and October 27th) low. The bulls want a measured move up from the October 13th low to the above measuring gap, which projects up to the August 24th low.
- The bulls also have a breakout above a major lower high (October 5th). The bulls want October 5th to be the neckline of a double bottom (October 13th low), and a measured move projects up to the August 24th low as well.
- While the market may rally to the August 16th high, it is more likely to go sideways around the 4,000 big round number.
- The bears still have an obvious trendline on the monthly chart (2008 low and 2020 low) that projects to around 3,000, and it is possible the market has to reach the trendline. The more the market goes sideways, the higher the trendline price will become.
- Overall, traders should expect a test of 4,000 big round number and for the bulls to become disappointed just like the bears.
Emini 5-minute chart and what to expect today
- Emini is down 25 points in the overnight Globex session.
- The market is in a tight bear channel, and the bears are trying to form an endless pullback following last Friday’s climactic rally.
- Traders should expect a trading range day and disappointment for both the bulls and the bears.
- The bulls want the Globex selloff to become an early low of the day and today to be a strong bull trend day which would be good follow-through for the bulls. The bears want the opposite and will try to create a strong reversal bar on the daily chart.
- As always, traders should expect a limit order market and sideways for the first hour. This means traders should consider waiting for 6-12 bars before placing a trade. This will help traders avoid getting tapped on a likely failed breakout.
- An alternative is to wait for a clear breakout with follow-through, such as consecutive trend bars closing on their extremes.
- There is a high probability of a swing trade beginning before the end of the first two hours. This means traders can consider waiting for a credible stop entry from a double top/bottom or a wedge top/bottom.
- If the open of the day is near the middle of the day’s range, traders should assume the day will try and have a trading range close and continue sideways.
- Overall, traders must remember that price is truth and not be in denial. One must trade the chart in front of them, not what they hope to see.
EURUSD Forex market trading strategies
EURUSD Forex daily chart

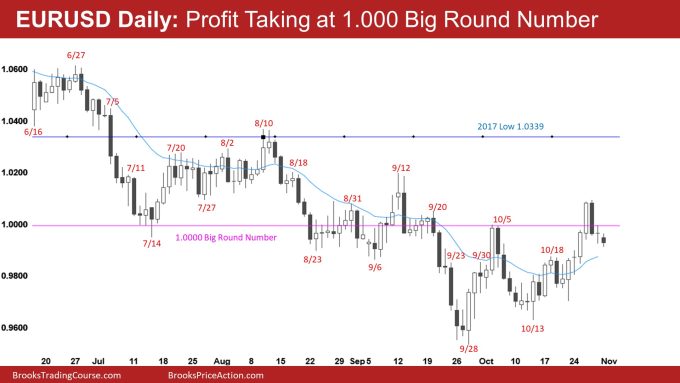
- The market went above the September 20th major lower high, which is good for the bulls. This increases the odds of a trading range or bull trend, not a bear trend.
- the market also reached the October 4th bull breakout and the 1.000 big round number, magnets I have talked about over the past couple of weeks.
- The market is now deciding how deep a pullback it will have.
- The bulls have an open gap at the October 18th high and will try their best to keep the breakout point open. The bears want to get a close below the October 18th high.
- The bears see two legs up at the October 27th high with a bear signal bar closing on its low.
- Traders will pay close attention to how deep of a pullback the bears can create here. If the selloff is weak, lasting a few legs, bulls will look for reasons to buy, betting on an upside breakout and test of the September 12th high.
- If the bears can get a strong bear trend bar today, the bulls will become more reluctant to buy.
Summary of today’s S&P Emini futures price action and what to expect tomorrow

Al created the SP500 Emini charts.
End of day review
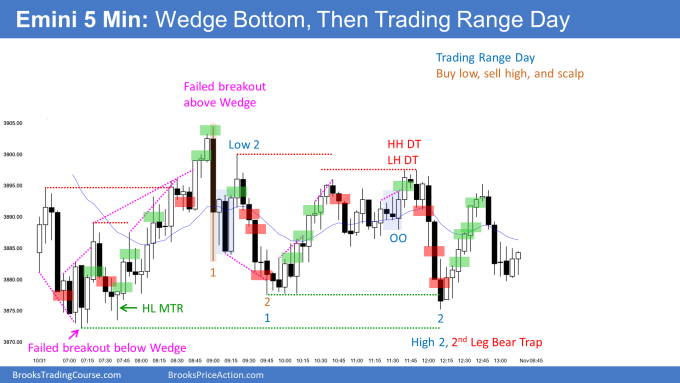
- The day formed an early wedge bottom, leading to a trading range day.
- Bulls got an early attempt at a higher low major trend reversal. However, the bear selloff on the open was enough damage (along with the gap down) to increase the odds of sideways trading and for any breakout above bar 2 to fail.
- The big bear bar at 9:00 AM PT was strong enough to create a big up, big down, so considerable confusion and trading range for the rest of the day.
- Overall, when you have a trading range, buying low, selling high, and scalp out is essential because any profits will be limited and brief. Generally, traders should expect most legs to fail after two to three legs, especially in the upper 1/3rd or lower 1/3rd.
End of day video review
See the weekly update for a discussion of the price action on the weekly chart and for what to expect going into next week.
Trading Room
Traders can see the end of the day bar-by-bar price action report by signing up for free at BrooksPriceAction.com. Al talks about the detailed S&P Emini futures price action real-time throughout the day in the BrooksPriceAction.com on trading room days. We offer a 2 day free trial.
Charts use Pacific Time
When times are mentioned, it is USA Pacific Time. The Emini day session charts begin at 6:30 am PT and end at 1:15 pm PT which is 15 minutes after the NYSE closes. You can read background information on the market reports on the Market Update page.
End of day video review added…