Market Overview: Weekend Market Analysis
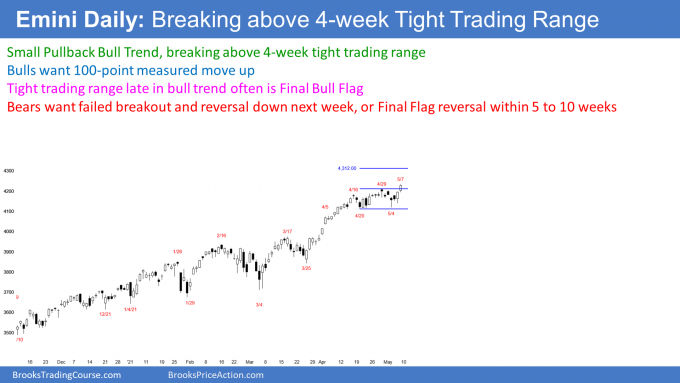
The SP500 Emini futures bulls got a breakout above the 4-week trading range on Friday. Trying to resume the Emini yearlong rally. They want Monday to be another bull bar, which would confirm the breakout and make higher prices likely. The bulls want a 100-point measured move up, based on the height of the 4-week trading range.
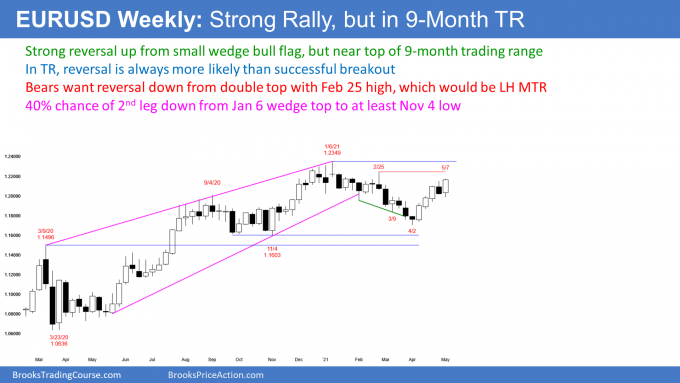
The EURUSD Forex market formed an outside up bar this week. That makes at least slightly higher prices likely. But it has been sideways for 9 months. The trading range should continue for at least a couple more months. Any move up or down in May will probably only last a couple weeks.
EURUSD Forex market
The EURUSD weekly chart

- This week triggered a sell signal by trading below last week’s low.
- It then traded above last week’s high and became an outside up bar.
- It closed above last week’s high and had a big bull body. This makes at least slightly higher prices likely next week.
- Next target is the February 25 lower high. The bulls want a breakout above that high, and a test of the January 6 high.
- Bears want a double top reversal down from that February 25 high.
- Alternatively, the bears want next week to be a bear inside bar, which would then be an ioi (inside-outside-inside) sell signal bar.
- Or, if next week trades above this week’s high, they want a reversal down, which would also be a sell signal bar. The bears currently have a 30% chance of getting a good sell signal bar next week.
- Bears want 2nd leg down from January 6 wedge top. They currently have 40% chance of reversal down to November 4 low, before breakout above January 6 high.
- In trading range for 9 months. Trading ranges resist change. Probably will remain in trading range for at least another couple months. This is true whether the rally continues up to the January 6 high, or there is a reversal down to the November 4 low.
S&P500 Emini futures
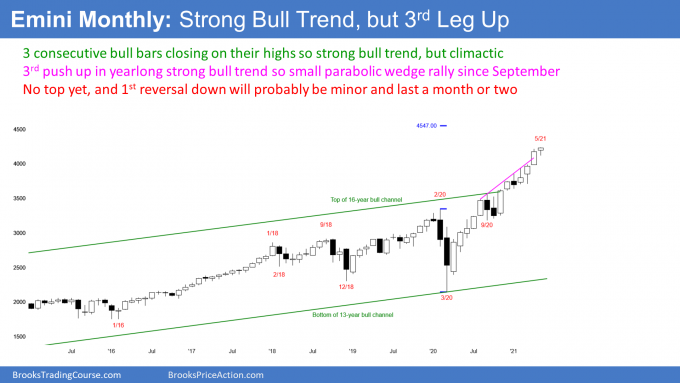
The Monthly Emini chart

- May so far is a small bull bar, and it is at a new all-time high.
- There is no top yet so traders continue to expect at least slightly higher prices.
- If May remains a bull bar, it will increase the chance of higher prices in June.
- If May is a bear bar, it would be a possible end of the 3rd leg up from the pandemic low. The 1st two legs ended in September and January.
- A reversal down from here would be from a micro parabolic wedge top.
- That is a buy climax, and traders would expect at least a couple small legs sideways to down.
- Because the pattern is a micro pattern, the reversal will probably be minor.
- Therefore, once there is a reversal, it should last for only 2- to 3-months.
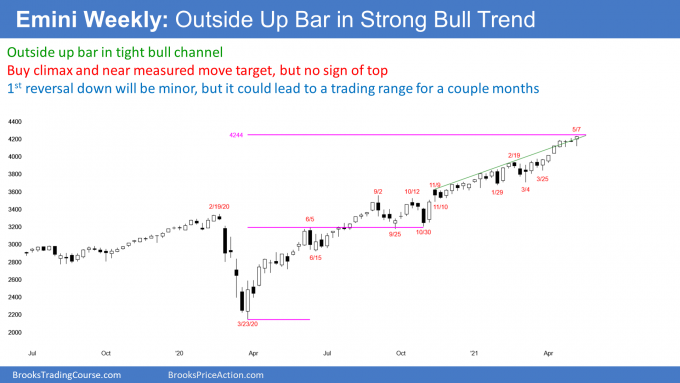
The Weekly S&P500 Emini futures chart

- This week traded below last week’s low, and then above its high. This week was therefore an outside up week, which is bullish.
- This week closed above last week’s high, which is also bullish.
- But its body was small, and therefore this week was not as strongly bullish as it could have been.
- There is a measured move target at 4,244.00, which is just above this week’s high. It is based on the June 5, 2020 high, which was tested twice (September and again end October).
- Closed near the high of the week, so might gap up next week.
- Small Pullback Bull Trend since pandemic low last year.
- A Small Pullback Bull Trend rarely lasts more than about 60 bars. Therefore, the bull trend will probably soon have a pullback, and transition into a trading range.
- 1st reversal down should be minor.
- The best the bears will probably get is a trading range for 2- to 3-months.
- 60% chance that once a correction forms, it will be 10%.
- 40% chance it will be 20%.
- The bull trend is so extreme that even once it resumes after a pullback, it might have a hard time getting much above the previous high. Therefore, the Emini could begin to form a broad trading range that could last many months.
- If the Emini enters a trading range for 10 or more bars, and there is a reliable sell signal, there would be a 40% chance of a major trend reversal.
- That means into a bear trend, and not just a trading range.
- A bear trend on the weekly chart means at least a few months of selling, and a retracement of about half of the yearlong rally.
- In summary, overbought bull trend, but the Emini should reach the measured move target above at 4,244. Also, there is no sign of a top. The 1st reversal down should be minor, even though the reversal could be the start of a trading range that could last for a few months.
The Daily S&P500 Emini futures chart

- There was a streak of 8 consecutive bear bars that ended on Thursday.
- Since that has happened only twice in the 23-year history of the Emini, it was extreme and climactic.
- Because the Emini was sideways for 4 weeks, it was a Breakout Mode pattern.
- Thursday’s strong reversal up was followed by a bull bar on Friday. Friday confirmed the reversal and it makes at least slightly higher prices likely next week.
- Consecutive big bull bars closing near their highs is a Bull Surprise, which typically will have at least a small 2nd leg up. Therefore, the bulls will buy the 1st 1- to 3-day pullback.
- Friday was also a breakout above the 4-week trading range.
- Monday is the follow-through bar. If it is a bull bar, especially a big bull bar closing near its high, it would increase the chance of a rally that could last a couple weeks. Traders would look for a 100-point measured move up, based on the height of the trading range.
- If Monday is only a small bull bar, it will make at least slightly higher prices likely next week.
- If Monday is a bear bar, especially a bar closing near its low, traders will conclude that Friday’s breakout failed. They would then look for the 4-week tight trading range to continue.
- Tight trading range late in a bull trend usually is the Final Bull Flag. That increases the chance that a rally from here will reverse down within about 5 weeks.
- A reversal down, whether or not there is a measured move up, could be the start of a 10% correction.
- There have been many reversal attempts since the March low. All failed within a few days.
- While a 10% correction is likely this summer, picking the exact top is a losing strategy. It is always more likely that the Emini will resume up after every reversal attempt.
- The bears need consecutive big bear bars before traders will conclude that the 10% correction is underway.
- In a bull trend, a correction is not clear until it is already half over.
Trading Room
Traders can see the end of the day bar-by-bar price action report by signing up for free at BrooksPriceAction.com. I talk about the detailed Emini price action real-time throughout the day in the BrooksPriceAction.com trading room. We offer a 2 day free trial.
Charts use Pacific Time
When I mention time, it is USA Pacific Time (the Emini day session opens at 6:30 am PT, and closes at 1:15 pm PT). You can read background information on the intraday market reports on the Market Update page.
E-mini monthly and weekly. Seeing channels within channels are confusing.
The channel formed in November 2020 has been the focus channel in your analysis over the past months. The older channel formed by last year’s (2020) 3/23 and 10/30 lows appears as important. The bull trend line that forms the older channel was important resistance on the weekly this past Feb and March (failed bear breakouts within 5 bars) and a reversal last week off the older bull trend line. If the older bull trend line remains important (and it appears so), I keep thinking about the older channel line, which is very far above, with context your discussions on enduring climaxes and blow-off tops. I don’t believe you conclude that older channel line way above is a logical magnet. Could you clarify why you do or do not recognize this older channel and why the channel formed this past November is more important.
As it relates to the decades long channel, the November 2020 (monthly) bar appears important again. The channel height appears re-charted from the 2007 highs to now intersect the 2004 high to the November 2020 bar. Whereas if a narrower channel height remained intersecting the 2007 highs, there would have been multiple failed bull breakouts (within 5 bars) above a narrower channel in 2018, 2019, and 2020. And indicates a successful breakout (more than 5 bars) after the July 2020 bar. Can you clarify why you consider re-charting a wider channel more important/relevant than a successful breakout after the July 2020 bar on the monthly chart.
Thank you very much if you have time to clarify and for always providing your analysis, helping us to understand.
sorry, in first paragraph, i meant bull trend line as important support (not resistance).
I pay attention to any support or resistance that I see. There are many more things taking place than what I put on the charts. I only show what I think is important near-term.
Once a market goes “far enough” beyond resistance, I conclude that the market does not view the resistance as important. A strong trend will ignore 80% of resistance levels (one of my 80% rule).
You are asking how far a market has to go above resistance for traders to decide that the resistance is not really resistance. On a 5-minute Emini chart, if a move goes 4 or more ticks beyond resistance, I conclude that the breakout will continue up and the resistance will fail. On a monthly chart, it could go more than a hundred points above a resistance level and then still reverse down from that resistance.
An alternative approach is to conclude that the resistance fails if the market does not start to reverse down within 5 bars after breaking above.
When a trend is strong like this, the odds are that every resistance will fail and the rally will continue. This is true even though the buy climax is going to reverse and the market is going to evolve into a trading range.
Picking the exact top is a low probability bet. As I have written many times, including in this weekend’s report, a reversal down from resistance is usually not clear until it is about half over.
Hi Al,
On the Globex daily chart there is no 8 consecutive bear bars. I know you don’t trade Globex charts but do you think in the recent years Globex chart is traded by more traders than let’s say 10 years ago? In my opinion price action on Globex charts is very reliable on all time frames lately, much more than in the past. What do you think?
I think more institutions watch the Globex chart and it is very reliable. Stuff happens on all charts and all of it can be important. The day session chart is a good measure of what is happening with the stock market on Wall St. Most traders do not look at 24-hour charts of stocks.
The streaks of 13 bull bars and 8 bear bars are not random events. They are signs that something is changing in the market.
If a strong bull trend is changing, it will soon stop being a strong bull trend. While I think the rally is resuming this week, those streaks are telling traders that this might be the final rally.
In addition, when an extreme bull trend ends, the correction is typically deeper and lasts longer than the biggest correction during the trend. That was the 10%, 2-month correction in September and October.
Also, when a strong bull trend resumes after the bigger correction, it typically is much less strong, and it often evolves into a big trading range, which could last a year or more.