Market Overview: EURUSD Forex
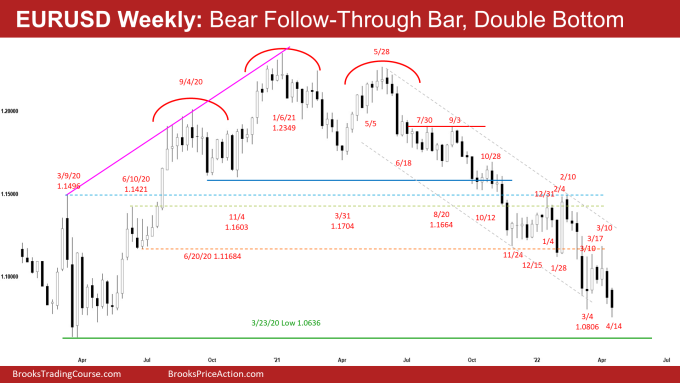
EURUSD bear follow-through trading sideways to down for the week. However, the weekly candlestick has a prominent tail below. The bears want a strong break below the March 4 low followed by a test of the March 2020 low. Bulls want a reversal higher from a double bottom with March 4 low and a lower low major trend reversal. The bulls will need to create strong consecutive strong bull bars to convince traders that a reversal higher could be underway. Odds slightly favor at least a small second leg sideways to down after a slightly larger pullback.
EURUSD Forex market
The Weekly EURUSD chart

- This week’s candlestick on the weekly EURUSD Forex chart was a big bear bar with a prominent tail below. It traded below March 4 low but closed above it.
- Last week, we said that odds slightly favor sideways to down and traders will be monitoring whether the bears get a follow-through bear bar or fail to do so.
- The bears got the follow-through bar which increases the odds of a deeper sell-off, but the prominent tail below indicates that the bears are not as strong as they could have been.
- The bears want a resumption of the bear trend and a test of the March 2020 low followed by a strong breakout below. If they get that, the next target for the bears is the bottom of the 7-year trading range – the January 2017 low.
- The bulls hope that the 4-month trading range (Nov 2021 to Feb 2022) is the final flag of the bear leg and want the breakout below to reverse higher from around the March 2020 low. The trading range came late in the bear trend, and that makes it a potential final bear flag.
- The bulls want a reversal higher from a double bottom with March 4 Low and a lower low major trend reversal. However, since this week was a big bear bar, it is a weak buy signal bar for a strong reversal up.
- The bulls will need at least a micro double bottom or a strong reversal bar before they would be willing to buy aggressively.
- Al has said that the market has been in a trading range for seven years. It is now near the bottom of the range. Reversals are more likely than breakouts. Therefore, as strong as the selloff has been, it is still more likely a bear leg in the seven-year trading range than a resumption of the 15-year bear trend.
- If the bears can get a couple of closes below the March 2020 low, the selloff should continue down to 2017 low, which is the bottom of the 15-year bear trend. A couple of closes below that low would probably be the start of a measured move down based on the height of the seven-year trading range.
- The odds of a reversal from the bottom of the trading range around the March 2020 low or around the January 2017 low is slightly higher than a strong breakout below the 2017 low and a measured move down.
- For now, odds slightly favor sideways to down for next week. Traders will be monitoring whether the bears get a 3rd consecutive bear bar and reach the measured move around 1.072 or the bulls manage to create a strong reversal bar instead.
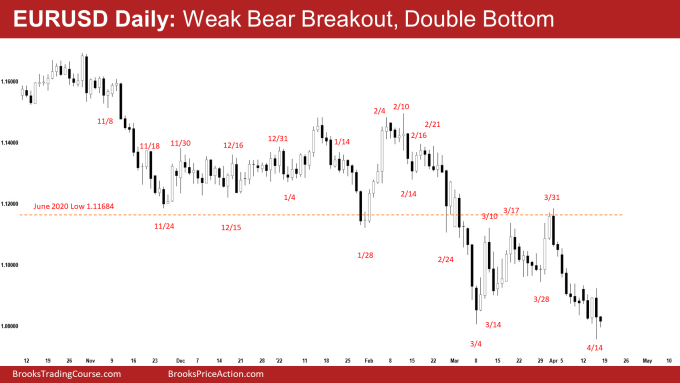
The Daily EURUSD chart

- The EURUSD gapped up on Monday but reversed to close as a bear bar and traded lower into Tuesday. Thursday was an outside bear bar with a long tail below.
- There is now an ioi (inside-outside-inside) pattern which means breakout mode.
- Last week, we said that odds favor at least a small second leg sideways to down after a pullback (bounce). The gap up on Monday was the pullback and the EURUSD traded sideways to down for the rest of the week.
- The bears have reached the 700-pip measured move lower based on the height of the yearlong trading range (August 2020 to August 2021) around 1.0855 during the spike down to March 4 low.
- They have not yet reached the 400-pip measured move based on the height of the 4-month trading range (Nov 2021 to Feb 2022) which will take them to around 1.072 which is very near to the March 2020 low.
- The sell-off in the last 2-weeks was in a tight bear channel. Odds favor the first reversal to be minor.
- The bulls want a reversal up from a double bottom with March 4 Low and a lower low major trend reversal.
- However, the bulls have not been able to create consecutive bull bars since the sell-off on March 31st. They need to do more by creating consecutive bull bars closing near the high to convince traders that a reversal higher may be underway.
- At the very least, they will need a micro double bottom or a strong bull reversal bar with follow-through buying before they would be willing to buy aggressively.
- As strong as the sell-off has been since January 2021, it is still more likely a bear leg in the 7-year trading range than a resumption of the 15-year bear trend.
- Traders will be monitoring whether the bears can get a strong breakout below March 4 low, or the bulls can reverse up with consecutive bull bars from a double bottom with March 4 and a lower low major trend reversal.
- For now, odds favor at least a small second leg sideways to down after a slightly larger pullback (bounce).
Market analysis reports archive
You can access all weekend reports on the Market Analysis page.
Hello, Andrew A! If I trade on the Daily chart, should I analysis the Weekly chart?
Hi TP,
A good day to you.
In the course, Al said that trade the chart in front of you. If you trade the daily chart, that’s all you need.
However, I find it useful to know what the other time frames are as background information in my mind.
Have a blessed week ahead.
Best Regards,
Andrew
Thank you, Andrew!
You’re most welcome..