Market Overview: EURUSD Forex
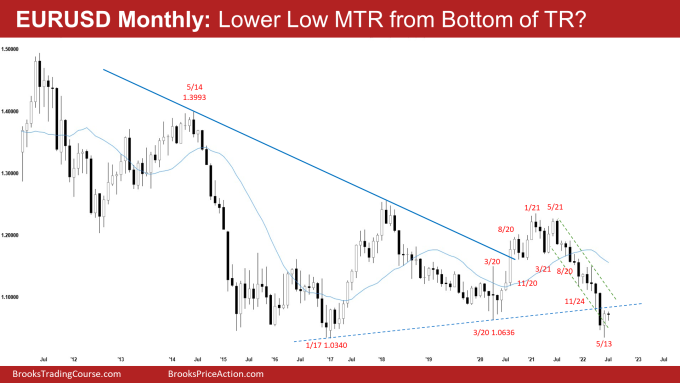
The EURUSD Forex closed as an EURUSD bull reversal bar on the monthly chart after testing the 2017 low. The bulls want a reversal higher from a lower low major trend reversal bar and a double bottom with the 2017 low.
However, the sell-off since June 2021 has been in a tight bear channel. Odds are, there should be at least a small second leg sideways to down after the pullback because v-bottoms are not common.
EURUSD Forex market
The Monthly EURUSD Forex chart

- The May Monthly EURUSD candlestick was a big bull reversal bar with a long tail below and a small tail above. It closed above March 2020 low.
- Last month, we said that odds slightly favor sideways to down to test the 2017 low. The EURUSD may need to test it before we see buyers return.
- However, because of the 1) oversold conditions, 2) trend channel line overshoot and 3) parabolic wedge, traders should be prepared for at least a small 2-legged sideways to up pullback (bounce) which can begin at any moment.
- The EURUSD tested the 2017 low in May and reversed up sharply.
- We have said that April was the largest bear bar since the bear leg started in June 2021. The largest bar(s) appearing late in the trend regularly appears near the end of a buy/sell climax.
- When the last bull has sold (capitulated – selling at any price to get out), there will not be enough sellers to push the market much lower. It may lead to at least a small 2-legged sideways to up pullback (bounce).
- The bulls hope that the sharp sell-off was a sell vacuum test of the 2017 low.
- They want a failed breakout from below March 2020 low and a reversal up from a trend channel line overshoot and parabolic wedge (August 20, November 24, May 13).
- The bulls also have a lower low major trend reversal and a double bottom with the 2017 low.
- Bears want a breakout below the 7-year trading range low followed by a measured move down based on the height of the 7-year trading range.
- They hope that the current pullback will be minor and want at least a small second leg sideways to down.
- Al has said that the market has been in a trading range for seven years. It is now near the bottom of the range. Reversals are more likely than breakouts. Therefore, as strong as the selloff has been, it is still more likely a bear leg in the seven-year trading range than a resumption of the 15-year bear trend.
- The odds of a reversal from the bottom of the trading range around March 2020 low or around the January 2017 low are slightly higher than a strong breakout below the 2017 low and a measured move down.
- Since May closed as a bull bar near the high, odds are June should trade at least slightly above May.
- The bulls will need to close June as a bull follow-through bar to convince traders that a reversal higher from the bottom of the 7-year trading range is underway.
- Because of the oversold context of the market (1) oversold conditions, 2) trend channel line overshoot and 3) parabolic wedge), a 2 legged sideways to up may have begun from May.
- That means it may last at least 2 to 3 months on the monthly chart.
The Weekly EURUSD chart

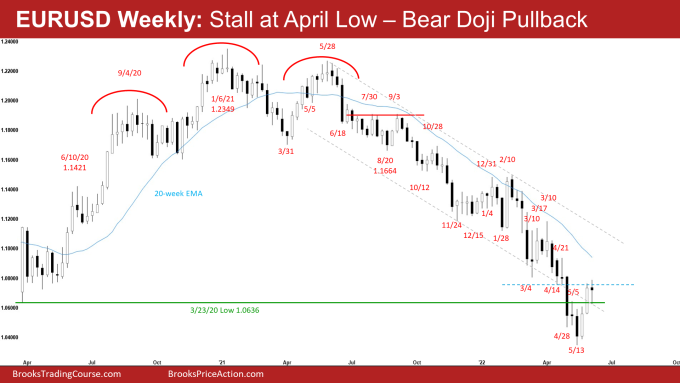
- This week’s candlestick on the weekly EURUSD Forex chart was a bear doji bar with tails above and below. It traded above last week’s high but closed below it.
- Last week, we said due to the market context (parabolic wedge, trend channel line overshoot, 7-year trading range low), the EURUSD likely have begun a 2-legged sideways to up pullback (bounce). This remains true.
- This week was a pullback after 2 consecutive bull bars. Odds slightly favor at least a small sideways to up leg after this pullback.
- The bulls want a reversal higher from a parabolic wedge (August 20, November 24, May 13) and a trend channel line overshoot.
- They also have a lower low major trend reversal and a double bottom with the 2017 low.
- The bulls hope that the sell-off since March was a sell vacuum test of the 7-year trading range low. They want at least a 2-legged sideways to up pullback. The 2 consecutive bull bars were likely the first leg up.
- The targets for the bulls are the last major lower high on April 21 or around the 20-week exponential moving average or the bear trend line.
- The bears want a retest of the 2017 low followed by a strong breakout and a measured move down based on the height of the 7-year trading range.
- Because of the tight channel down, the bears expect at least a small second leg sideways to down after the pullback is over. This remains true.
- Al has said that the market has been in a trading range for seven years. It is now near the bottom of the range. Reversals are more likely than breakouts.
- Therefore, as strong as the sell-off has been, it is still more likely a bear leg in the seven-year trading range than a resumption of the 15-year bear trend.
- For now, odds are the EURUSD is still in the 2 legged sideways to up pullback phase.
Market analysis reports archive
You can access all weekend reports on the Market Analysis page.