Market Overview: EURUSD Forex
EURUSD consecutive bear bars below the 7-year trading range which confirmed the breakout. Bears want a measured move down based on the height of the 7-year trading range which will take them to the year 2000 low. While odds favor lower prices, the trend channel line overshoot and the wedge bottom increase the odds of at least a small sideways to up pullback beginning within 1 to 3 weeks before the EURUSD continues lower.
EURUSD Forex market
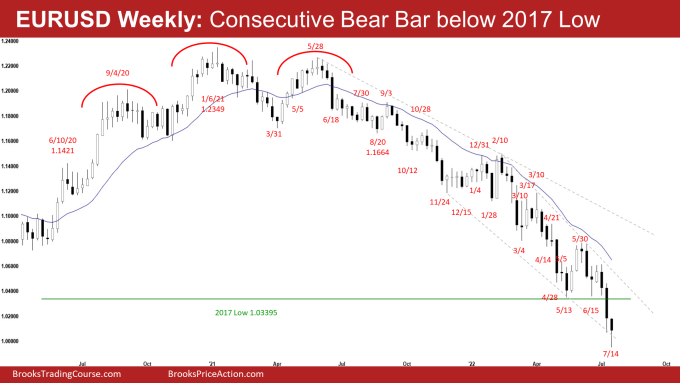
The Weekly EURUSD chart

- This week’s candlestick on the weekly EURUSD Forex chart was a consecutive bear bar below the 7-year trading range with a long tail below.
- Last week, we said that the big bear bar with a long tail below was a weaker sell signal bar and the odds slightly favor sideways to down. Traders will see whether the bears can create follow-through selling.
- Bears got the follow-through selling that they wanted this week.
- However, the prominent tail below the last 2 candlesticks indicates that the bears are not as strong as they could have been.
- The bears wanted a strong breakout below 2017 low and a measured move down based on the height of the 7-year trading range which will take them to the year 2000 low.
- We have said if the bears get at least 2 strong bear bars closing below the 2017 low, the odds of a breakout and a measured move increase. They have gotten that now.
- The bulls hope the sell-off since March was a sell vacuum test of the 7-year trading range low.
- They want a reversal higher from a wedge bottom (Mar 4, May 13 and July 14), and a trend channel line overshoot.
- The bulls hope that the recent 10-week trading range is the final flag of the move down which started in 2021. They want a failed breakout below the 7-year trading range.
- The move down is in a tight bear channel. That means strong bears.
- Odds slightly favor sideways to down and further lower prices.
- However, the move down has also been climactic.
- The wedge bottom and trend channel line overshoot increases the odds of at least a small sideways to up pullback beginning within 1-3 weeks before the EURUSD continue lower.
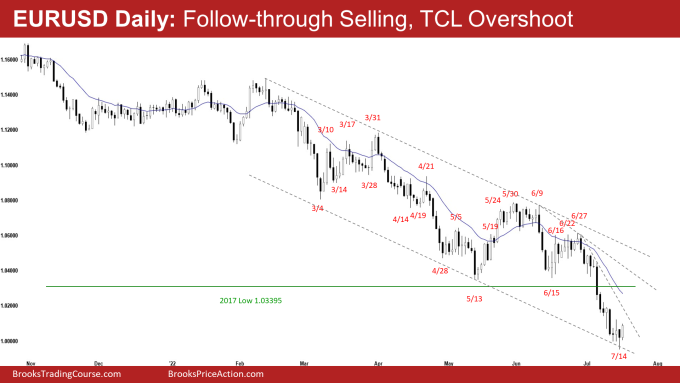
The Daily EURUSD chart

- The EURUSD spiked down on Monday and traded sideways for the rest of the week. Friday traded higher helping the week close off the low.
- Last week, we said that odds slightly favor at least a small second leg sideways to down after a pullback.
- This week traded lower and almost reached a measured move based on the height of the 10-week trading range.
- The bears want a measured move down based on the height of the 7-year trading range. That would take them to the year 2000 low.
- The move down since July is in a tight bear channel. Traders expect at least a small second leg sideways to up after a larger pullback.
- Bears want an endless small pullback trend lower.
- The bulls hope that the 10-week trading range is the final flag of the move down since 2021. They want a failed breakout below the 7-year trading range.
- The bulls want a reversal higher from a wedge bottom (Mar 4, May 13 and July 14) and a trend channel line overshoot.
- They will need to create consecutive bull bars closing near their highs to increase the odds of a failed breakout.
- For now, the wedge bottom and trend channel line overshoot increase the odds of at least a small 2-legged sideways to up pullback beginning within 1-3 weeks. The pullback may have begun this week.
- However, the sell-off since July is in a tight bear channel. That means strong bears. Odds continue to favor lower prices.
- Traders expect at least a small second leg sideways to down to re-test the July 14 low after a slightly larger pullback.
Market analysis reports archive
You can access all weekend reports on the Market Analysis page.