Market Overview: EURUSD Forex
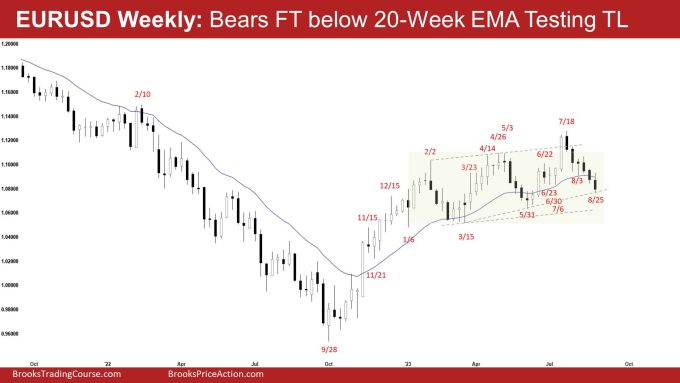
The weekly chart was a EURUSD consecutive closes below the 20-week EMA, testing the bull trend line. While the odds continue to favor the market to trade at least a little lower, a minor pullback can begin within a few weeks. Odds favor a second leg sideways to down after a pullback.
EURUSD Forex market
The Weekly EURUSD chart

- This week’s candlestick on the weekly EURUSD Forex chart was another consecutive bear bar closing in the lower half with a small tail below.
- Last week, we said that the EURUSD may still trade sideways to down in the coming week(s) and traders will see if the bears can create a follow-through bear bar.
- The bears got a follow-through bear bar following last week’s close below the 20-week EMA.
- They got a reversal from a wedge top (Feb 2, Apr 26, and Jul 18), a trend channel line overshoot and a higher high major trend reversal.
- The move down is in a tight bear channel consisting of 6 consecutive bear bars, testing the bull trend line.
- If there is a pullback (bounce), the bears want it to be weak (overlapping bars, doji(s), bear bars) and sideways, followed by another leg down from a lower high major trend reversal.
- The bulls hope that the current leg down is simply a pullback and want at least a small leg to retest the July 18 high. They see the market as still being in a broad bull channel.
- They want the bull trend line to act as support and the market to form a higher low.
- They will need a strong reversal bar or at least a micro double bottom before they would be willing to buy more aggressively.
- Since this week was a bear bar closing near its low, it is a sell signal bar for next week. It is not a strong buy signal bar.
- The EURUSD may still trade at least a little lower.
- Traders will see if the bears can break below the bull trend line or will the market trade slightly lower but close with a long tail below or a bull body.
- If the bears continue to create strong consecutive bear bars, it will increase the odds of the reversal being successful.
- For now, the odds slightly favor at least a small second leg sideways to down after a pullback.
The Daily EURUSD chart

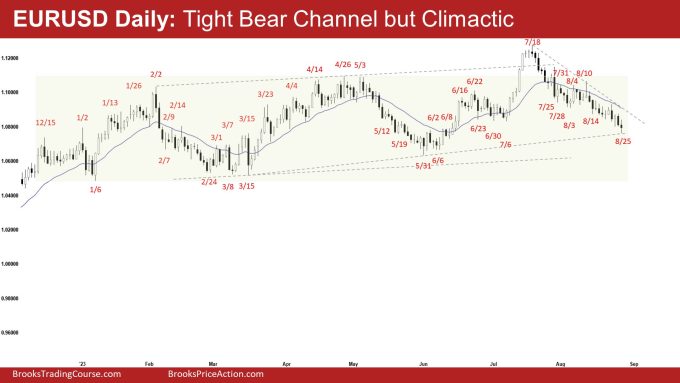
- The EURUSD traded sideways to down for the week. Friday traded lower but closed with a long tail below.
- Last week, we said that the EURUSD may still be in the sideways to down pullback phase and traders will see if the bears can a strong test and break below the bull trend line or will the market start to stall around the current levels.
- The market traded lower this week and tested the bear trend line.
- The bears got a reversal from a trend channel line overshoot, a wedge top (Feb 2, Apr 26, and Jul 18) and a higher high major trend reversal.
- They want a strong breakout below the bull trend line.
- The move down since July 18 is in a tight bear channel. That increases the odds of at least a small second leg sideways to down after a pullback.
- If there is a pullback (bounce), the bears want a reversal down from a lower high major trend reversal.
- The bulls hope that the recent move down is simply a deep pullback and at least a small retest of the prior leg extreme (July 18).
- They want the market to stall around the bull trend line area and reverse up.
- Because of the strong move down, the bulls would need to create consecutive bull bars closing near their highs (bull spike) breaking far above the minor bear trend line (drawn from Jul 18 high) to increase the odds of higher prices.
- While the EURUSD may still be in the sideways to down pullback phase, the move has lasted a long time and is slightly climactic.
- A minor pullback can begin within a few weeks.
- However, because of the tight bear channel down, odds slightly favor at least a small second leg sideways to down to test the current leg extreme low (now August 25).
- For now, traders will see if the bears can create a breakout below the bull trend line, or will a minor pullback begin within the next few weeks.
- If the bears get a strong breakout below the bull trend line with follow-through selling, it will increase the odds of a deeper reversal.
- If a pullback (bounce) begins, traders will see the strength of the pullback. If it is weak (overlapping bars, doji(s), bear bars) and sideways, the odds of another leg down increase.
Market analysis reports archive
You can access all weekend reports on the Market Analysis page.
Thx for every thing. I usualy check here before take decisions.
I hope the bulls make a strong leg because i see a great broad channel in the week chart. Id like to ask a question. We Know that broad channel we have to buy low, sell hight, scalp, right? So if a put a stop buy order below last candle, would I be committing a price action (All) sin?
Dear Ciro,
Thanks for going through the report..
I want to clarify your question.
Do you mean you will place a limit buy order below the last candlestick on the weekly chart?
I don’t make trade recommendations here nor anywhere else on the website.. but I can share some of my thoughts..
The problem with the bull’s case is that the selloff is quite strong (6 consecutive bear bars). On the weekly chart, the bulls also do not have a strong signal bar, and the channel down is tight (on both weekly and daily chart).
Buying above a strong signal bar has a higher chance of being profitable.
Let’s see how the market plays out next week for more clues..
Let me know if I have answered your question..
Wishing a blessed week ahead to you..
Best Regards,
Andrew
Great,
You answered my question perfectly.
God bless you
Dear Ciro,
You’re most welcome..
Take care and be well there with your loved ones..
Best Regards,
Andrew
Dear Ciro,
If today (Tuesday) closes near its high (an outside bull bar), it would be a good signal bar (on the daily chart) for Wednesday.
It could be the start of a 2 legged sideways to up minor pullback.
How strong the pullback (bounce) remains to be seen though..
Let’s see how the market play out.
Best Regards,
Andrew