Market Overview: EURUSD Forex
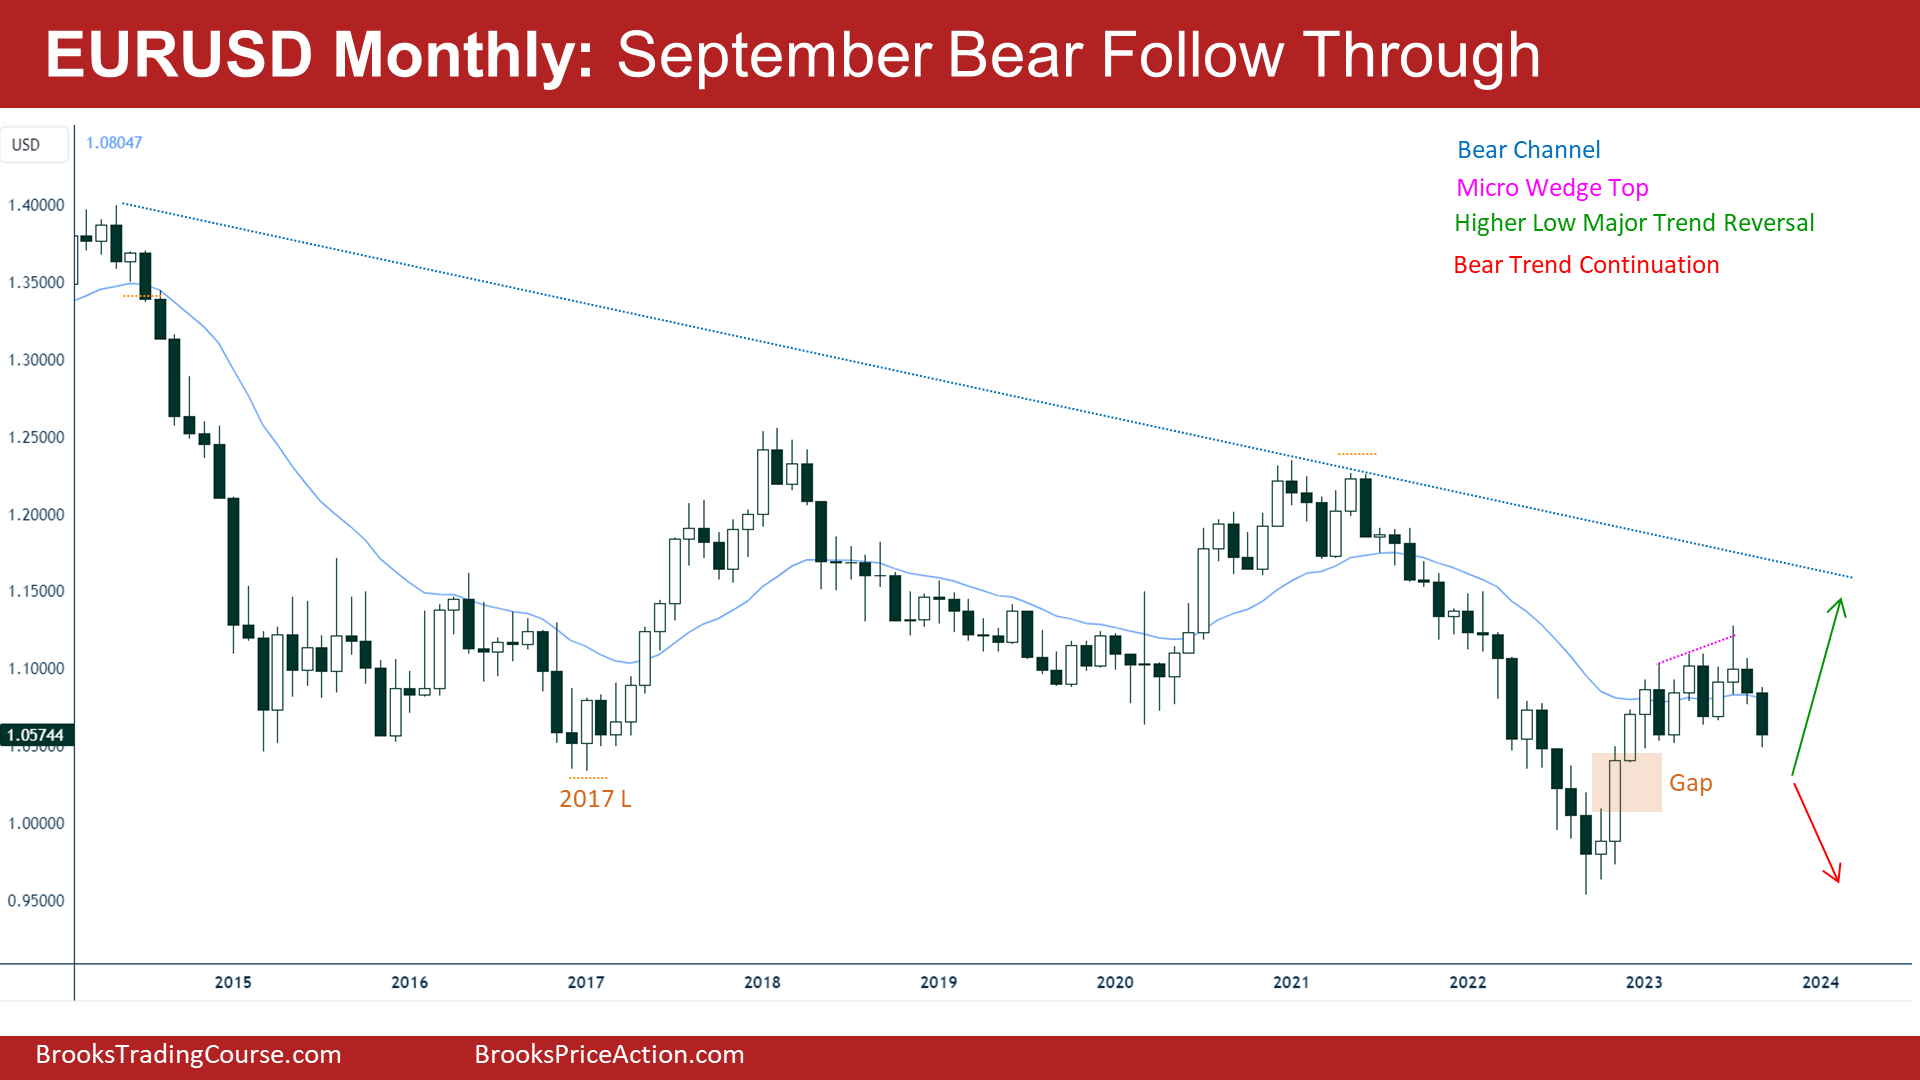
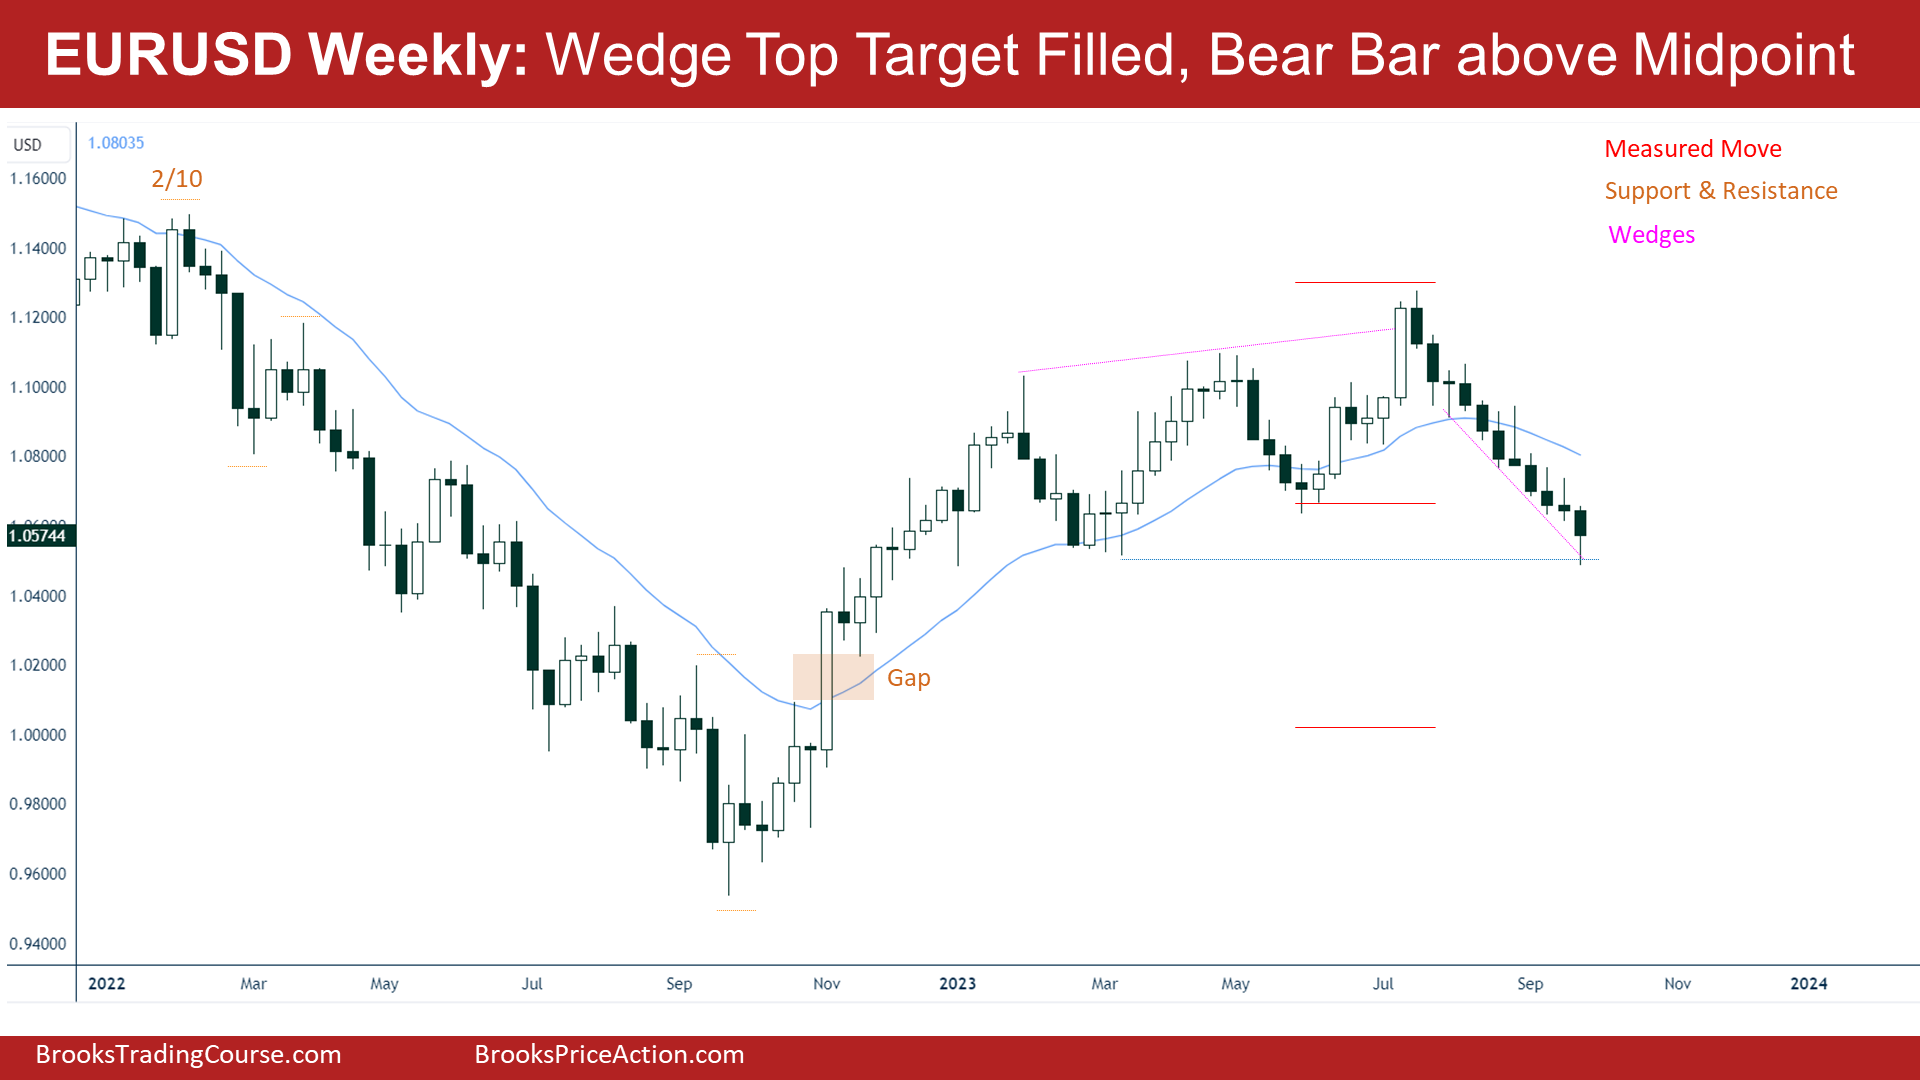
The EURUSD Forex Monthly chart, achieved a strong bear follow through bar that reached the 1.05 Big Round Number. On the weekly, the price reached their targets, but since the leg down has been in a strong and tight bear channel, the odds favor a leg sideways to down after a pullback. A pullback is expected within the next 1–3 weeks.
EURUSD Forex market
The Monthly EURUSD Forex chart

- August’s candlestick was a bear bar closing in the lower half. It was a sell signal bar for September.
- The September monthly EURUSD candlestick is a bear bar closing in the lower third of its range. It is a good follow through bear bar.
- Moreover, bears broke and closed below June and May lows, which increases the odds of at least lower prices during the following month.
- During the last monthly report, we said that the odds favored at least lower prices and that if bears create a follow-through bear bar in September, that would increase the odds of a deeper pullback or a reversal down.
- The bulls wanted a reversal up from a wedge bull flag (Mar 15, May 31, and Aug 25) followed by a strong leg up lasting a few months.
- Bulls wanted a reversal up from a wedge bull flag (Mar 15, May 31, and Aug 25) and the 20-month exponential moving average (EMA) to act as support.
- Furthermore, bulls hope that the gap might hold a reversal down and create a higher low major trend reversal.
- While the market was Always In Long, the move up since September 2022 has lasted a long time.
- The market needed to trade sideways to down to work off the overbought condition.
- For now, odds slightly favor the EURUSD to trade at least a little lower.
- Traders will see if the bears can create a third consecutive bear bar which may turn the market Always In Short.
The Weekly EURUSD chart

- This week’s candlestick on the weekly EURUSD Forex chart is a bear bar closing above its midpoint.
- In the past couple of weeks, we said that while odds continue to slightly favor sideways to down, that the move down has lasted a long time and is slightly climactic. A minor pullback can begin within a few weeks.
- Now that the price reached the bear’s target at the beginning of the bull channel or wedge top, which is also the 1.05 big round number, the price might start the pullback.
- The bears got a reversal from a wedge top (Feb 2, Apr 26, and Jul 18), a trend channel line overshoot and a higher high major trend reversal.
- The move down is in a tight bear channel consisting of 10 consecutive bear bars.
- There is a measured move target based upon the size of the latest bull leg, that suggests that the price might reach the parity (and close a bull gap). That would be a successful bear reversal.
- That increases the odds of at least a small second leg sideways to down after a pullback.
- The bears want the pullback to be weak (overlapping bars, doji(s), bear bars) and sideways, followed by another leg down from a lower high major trend reversal.
- The bulls hope that the current leg down is simply a deep pullback.
- They want a reversal up from a double bottom bull flag (Mar 15) and a parabolic wedge.
- They see the market as still being in a broad bull channel.
- The major bull trend line has been broken, since this week the price traded too far below instead of returning above or nearby.
- They will need a strong bull reversal bar or at least a micro double bottom before they would think to buy more aggressively.
- If the price reverses up strongly during the upcoming weeks, bulls might see a possible expanding triangle formation.
- While the market is sitting at a potential support area (bottom of trading range), the bulls still need to do more to prove that they are at least temporarily back in control. Remember, the problem of the bull’s case is that the move down has been forceful.
- Since this week was a bear bar closing above its midpoint within a parabolic wedge bottom pattern, stalling at a technical target which is also a big round number support, the price might start a pullback next week.
- Any pullback would likely be minor and favor at least a small second leg sideways to down after the pullback.
Market analysis reports archive
You can access all the weekend reports on the Market Analysis page.
I understand what you mean by the bottom of a trading range but not a bull trend line as support unless you are saying the bounce off of last week’s low as the potential 2nd push down in the bull trend line that just formed. To me it looks like all major bull trendlines have been broken. If you drew one from Feb ’02 to Sep ’22 it isn’t that close to that yet. I am assuming that is not what you mean by potential support at a bull trend line. Please explain if you can.
Dear Chris, you are right, after the past week’s candlestick, the price, instead of returning to the bull trend line, it continued to trade far below. It is a fact that the bull trend line is not viewed anymore as support, only the TR bottom (potential Expanding Triangle Bottom). I should not include that into the report, instead of pointing out that has the trend line has been broken and traders do not have any possible new bull trend line. Thank you for the observation, wishing you a great week ahead, Josep.
Thanks Josep!
Well thought out and easy to read. Thank you.
Thank you for your reading, Mark! We are glad that you find this report useful. Have a lovely week ahead, Josep. 😀