Market Overview: EURUSD Forex
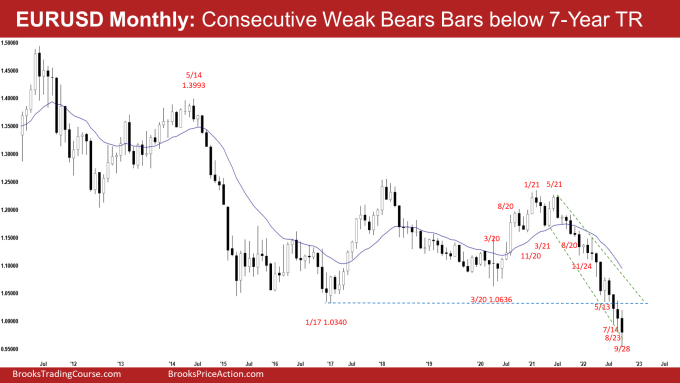
The EURUSD Forex monthly candlestick was another EURUSD weak bear bar after breaking below the 7-year trading range low. There is now a micro wedge (July, Aug and Sept) on the monthly chart. Bulls want a larger 2-legged sideways to up pullback before the EURUSD trades lower. The problem with the bull’s case is that they have not been able to create sustained follow-through buying since 2021.
EURUSD Forex market
The Monthly EURUSD Forex chart

- The September Monthly EURUSD candlestick was a bear bar with a prominent tail below, closing in the lower half of the month’s range.
- Last month, we said that odds slightly favor sideways to down. If September trades below the August low, but closes with another long tail below, there would be a micro wedge (July, Aug, September).
- September broke far below the August low, but the long tail below indicates that the bears are not as strong as they could have been.
- The bulls want a failed breakout from the 7-year trading range low. They want a reversal up from a trend channel line overshoot and parabolic wedge (Nov 24, May 13 and Sept 28).
- They also have a micro wedge (July, Aug, September).
- However, the bulls have not been able to create strong consecutive bull bars since the selloff in 2021.
- Bears want a measured move down based on the height of the 7-year trading range, which will take them to the year 2000 low.
- The selloff since June 2021 is in a tight bear channel. That means persistent selling and strong bears.
- The bears got consecutive bears bar following the breakout below the 7-year trading range. However, the candlesticks (July, Aug, September) have prominent tails below.
- Since September was a big bear bar with a long tail below, it is a weaker sell signal bar for October.
- Odds continue to slightly favor lower prices for the EURUSD.
- However, the selling has been climactic. The trend channel line overshoot (September) and parabolic wedge bottom (Nov 24, May 13 and Sept 28), increase the odds of at least a small sideways to up pullback, beginning within 1-2 months before the EURUSD continues lower.
The Weekly EURUSD chart

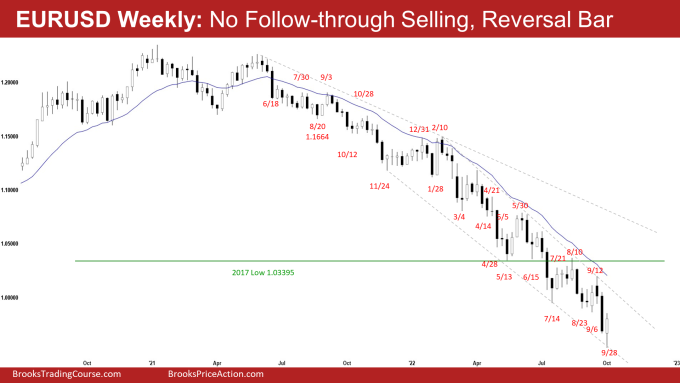
- This week’s candlestick on the weekly EURUSD Forex chart was a bull reversal bar with a long tail below, and a prominent tail above.
- Last week, we said that odds slightly favor sideways to down and traders will see if the bears get a follow-through bear bar or fail to do so.
- This week traded lower but reversed to close with a bull body.
- The bears want a strong breakout below the 2017 low, and a measured move down based on the height of the 7-year trading range. This will take them to the year 2000 low.
- The move down is in a tight bear channel. That means strong bears.
- While last week’s breakout below the July-August low was strong, the bears failed to get follow-through selling this week.
- The bulls hope that the recent 10-week trading range (July to Sept) is the final flag of the move.
- They want a reversal higher from a wedge bottom (May 13, July 14 and Sept 28) and a trend channel line overshoot (this week).
- However, the bulls kept failing to get sustained follow-through buying, a recurring theme since the selloff started in 2021.
- The bulls will need to create strong consecutive bull bars closing near their highs, breaking far above the bear trend line to convince traders that a larger sideways to up pullback may be underway.
- Since this week was a bull reversal bar closing near the high, it is a buy signal bar for next week.
- Traders will be monitoring if the bull can get a follow-through bull bar next week or fail to do so.
- If the bulls get a consecutive bull bar, it could be the start of a larger 2-legged sideways to up pullback lasting at least a few weeks.
Market analysis reports archive
You can access all weekend reports on the Market Analysis page.